Figure 1.

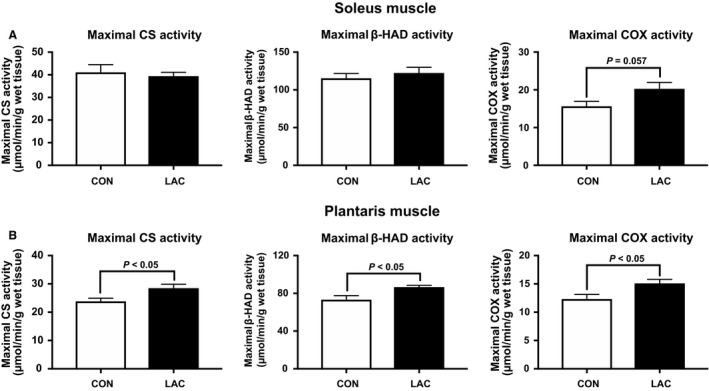
Mitochondrial enzyme activity in Experiment 1. Maximal CS, β‐HAD, and COX activities in the soleus muscle (A) and the plantaris muscle (B) after 3 weeks of administration. Data are expressed as mean ± SEM. n = 6.

Mitochondrial enzyme activity in Experiment 1. Maximal CS, β‐HAD, and COX activities in the soleus muscle (A) and the plantaris muscle (B) after 3 weeks of administration. Data are expressed as mean ± SEM. n = 6.