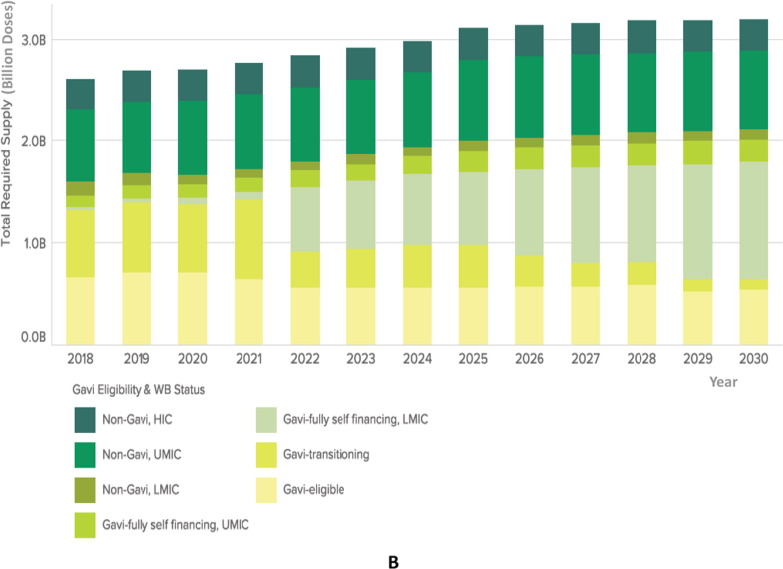
Fig. 3B.
Illustration of forecasted global routine demand by country income group and Gavi eligibility. The total required supply of vaccines, in billions of doses, is displayed in the Y axis. Vaccines are color coded according to Gavi eligibility and World Bank status. Gavi countries (fully eligible, transitioning, self-financing) are depicted in yellow and light green shading, while non-Gavi High Income Countries (HICs) are depicted in dark green colors, on the top of the columns. The years included in the forecast are reflected in the X axis (2018–2030). Demand by income group may change considerably over the next decade as many Gavi-eligible countries transition to become self-financing. As a result, non-Gavi self-financing Middle Income Countries (MICs) will comprise the majority proportion of global demand by 2028. Supply requirements are unlikely to change in non-Gavi MICs and HICs. Abbreviations: WB: World Bank; HIC: high income countries; UMIC: upper-middle income countries; LMIC: lower-middle income countries. Source: Global Vaccine Market Model, owned by Linksbridge, July 2018. (Figures courtesy of E. Baker). Note: volumes include routine vaccine program demand only. (For interpretation of the references to color in this figure legend, the reader is referred to the web version of this article.)

