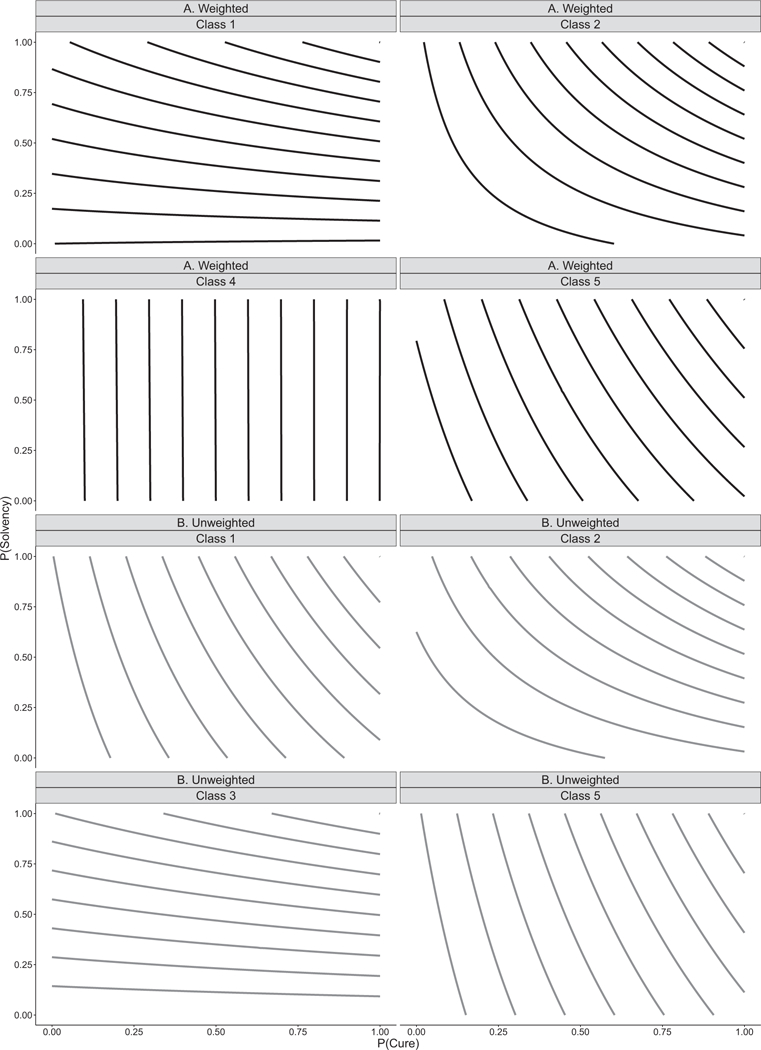
Fig. 1 –

Indifference curves for segments of the American population, with their share of the population. See the main text for a discussion of the omitted classes. (A) Weighted for national representativeness. (B) Unweighted.

Indifference curves for segments of the American population, with their share of the population. See the main text for a discussion of the omitted classes. (A) Weighted for national representativeness. (B) Unweighted.