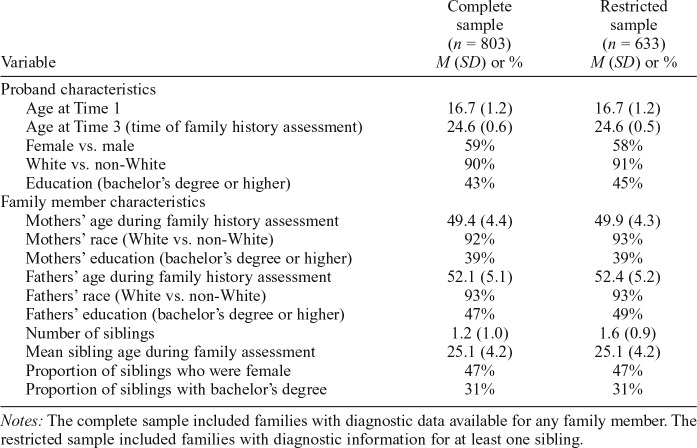
Table 1.
Demographic characteristics of probands and family members
| Complete sample (n = 803) M (SD) or % | Restricted sample (n = 633) M (SD) or % | |
| Variable | ||
| Proband characteristics | ||
| Age at Time 1 | 16.7 (1.2) | 16.7 (1.2) |
| Age at Time 3 (time of family history assessment) | 24.6 (0.6) | 24.6 (0.5) |
| Female vs. male | 59% | 58% |
| White vs. non-White | 90% | 91% |
| Education (bachelor’s degree or higher) | 43% | 45% |
| Family member characteristics | ||
| Mothers’ age during family history assessment | 49.4 (4.4) | 49.9 (4.3) |
| Mothers’ race (White vs. non-White) | 92% | 93% |
| Mothers’ education (bachelor’s degree or higher) | 39% | 39% |
| Fathers’ age during family history assessment | 52.1 (5.1) | 52.4 (5.2) |
| Fathers’ race (White vs. non-White) | 93% | 93% |
| Fathers’ education (bachelor’s degree or higher) | 47% | 49% |
| Number of siblings | 1.2 (1.0) | 1.6 (0.9) |
| Mean sibling age during family assessment | 25.1 (4.2) | 25.1 (4.2) |
| Proportion of siblings who were female | 47% | 47% |
| Proportion of siblings with bachelor’s degree | 31% | 31% |
Notes: The complete sample included families with diagnostic data available for any family member. The restricted sample included families with diagnostic information for at least one sibling.

