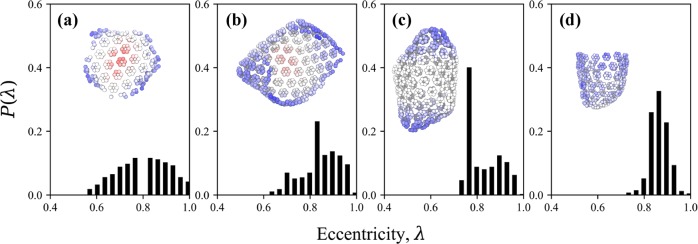
Figure 2.
Topology of the assembled CA lattice is assessed by the eccentricity (λ) of each vertex (i.e., each CA monomer) in a graph representation of the lattice. We show the distribution of λ (P(λ)) at select points during one trajectory of [CA+]CI = 0.100 mM for demonstrative purposes: at (a) 1 × 10⁸, (b) 7 × 10⁸, and (c) 14 × 108 MD timesteps. The same analysis is performed in (d) using half of the lattice from (c), i.e., after cleavage by a plane perpendicular to the long axis of the capsid. Representative lattices are depicted as insets in (a-d) with each monomer shown as a sphere colored by its λ from red (λ = 0.5) to blue (λ = 1.0). The topology of the lattice can be qualitatively characterized by the skew of the distribution of λ (γ(λ)) in which (a,d) zero skew is indicative of an open lattice with isotropic edges, (b) negative skew is indicative of an open anisotropic lattice, and (c) positive skew is indicative of a closed, non-spherical lattice.

