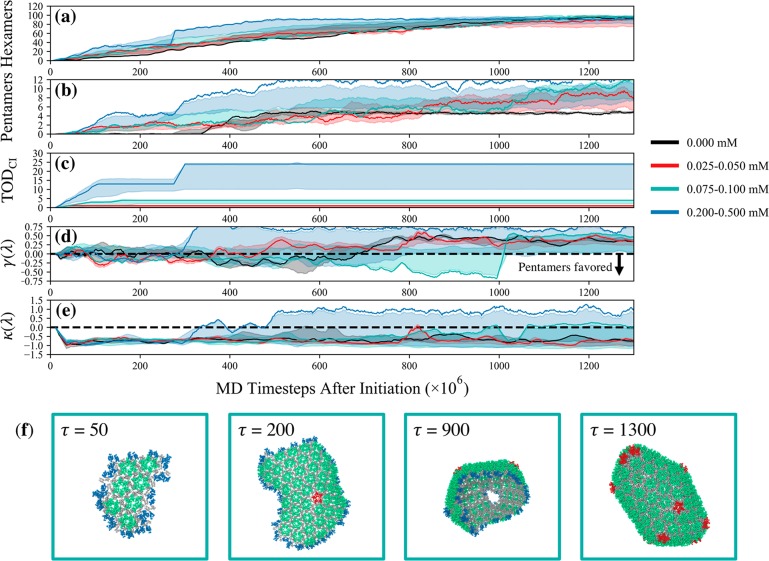
Figure 3.
Assembly time-series plots that depict (a) the number of assembled hexamers, (b) the number of assembled pentamers, (c) the number of incorporated inhibitor-bound TODs (TODCI), and the (d) skew (γ(λ)) and (e) kurtosis (κ(λ)) of the distribution of eccentricities (λ) throughout the assembled lattice as a function of CG MD time step (shifted with respect to the onset of lattice growth) for each system within the listed concentration of capsid inhibitors (CIs). We find accelerated assembly, especially with respect to pentamers, in the CI-present simulations, which appear to be commensurate with negative γ(λ) and κ(λ), i.e., a descriptor that indicates anisotropic edge growth in the protein lattice. The shaded region depicts the standard deviation around the mean from four trajectories within the listed range of concentrations while the solid line depicts a single trajectory. In (f), molecular snapshots of the protein lattice for the 0.100 mM case (green line in (a)–(e)) at the listed MD time step (τ [×106]) are shown; green, red, and blue NTD domains in capsomers indicate hexamers, pentamers, and incomplete capsomers, respectively.

