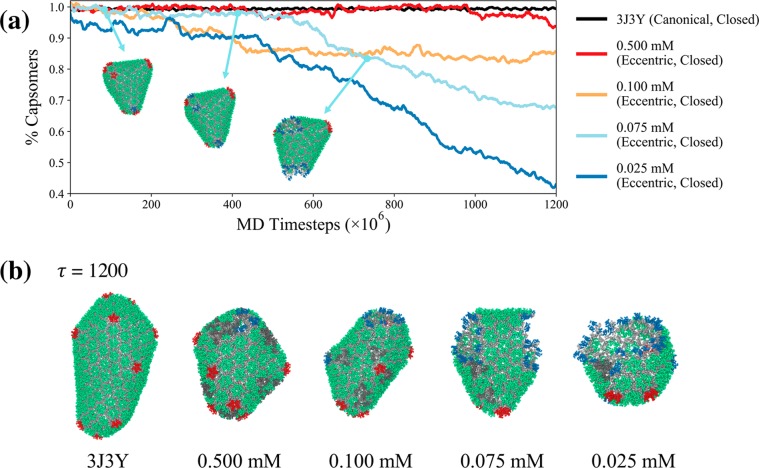
Figure 5.
(a) Disassembly time-series plot that depicts the fraction of remaining hexamers and pentamers (with respect to the initial size of the mature capsid core) for the five listed systems as a function of MD time step. All four of the eccentric cases exhibit spontaneous disassembly, which appear to be initiated at sites with large pentamer density. Molecular snapshots of the protein lattice for the 0.075 mM case (cyan line in (a)) at the indicated points are shown; green, red, and blue capsomers indicate hexamers, pentamers, and incomplete capsomers, respectively. (b) Molecular snapshots from each trajectory at the indicated MD time step (τ [×106]) are shown. The inhibitor-bound TODs are represented as gray capsomers. This data suggests that capsid inhibitors promote the formation of “leaky” mature cores that spontaneously open at regions of high curvature (or high pentamer density), and represents one failure mechanism that suppresses infectivity.

