Figure 4.

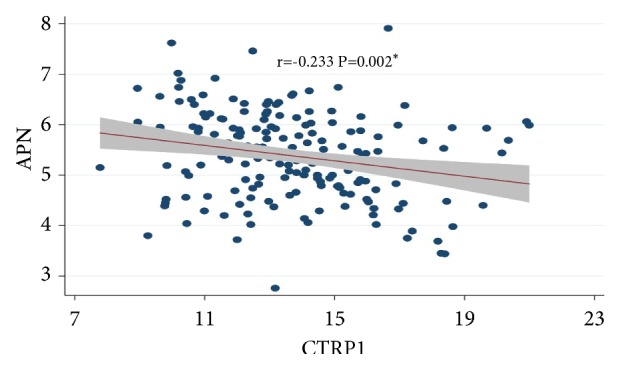
Scatter diagram of correlation between CTRP1 and APN. Note: CTRP1 (r value was -0.233) was significantly negatively correlated with APN (∗P<0.05) in the hypertension group 1 and the “shade” represents 95%CI of fitted line.

Scatter diagram of correlation between CTRP1 and APN. Note: CTRP1 (r value was -0.233) was significantly negatively correlated with APN (∗P<0.05) in the hypertension group 1 and the “shade” represents 95%CI of fitted line.