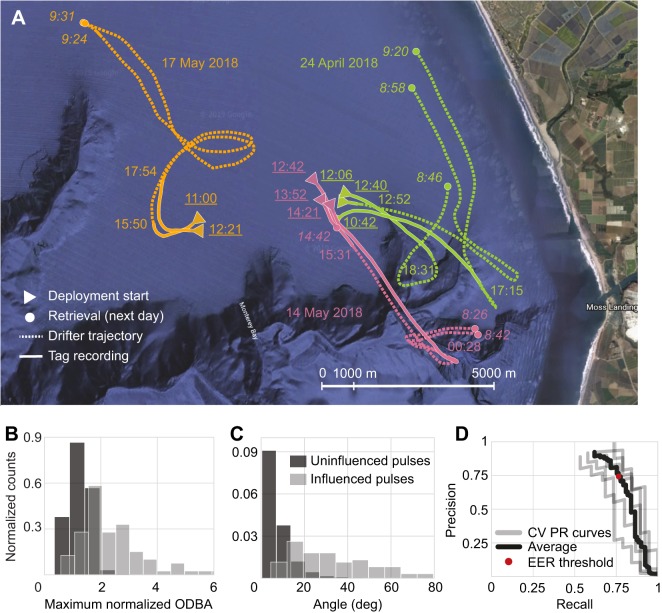
Fig. 2.
In situ deployment trajectories, effects of tether influence and precision–recall curve of activity classifier. (A) Trajectories for the three deployment dates. Underlined times (PDT) denote deployment start; italicized times denote when tag was recovered; remaining times denote when tag stopped recording. (B) Maximum overall dynamic body acceleration (ODBA) and (C) total orientation change over annotated tether-influenced (N=83) and uninfluenced periods (N=1245). (D) Cross-validation (CV) precision–recall (PR) curves of the activity classifier, and precision and recall using the equal error rate threshold (EER).

