Figure 1.

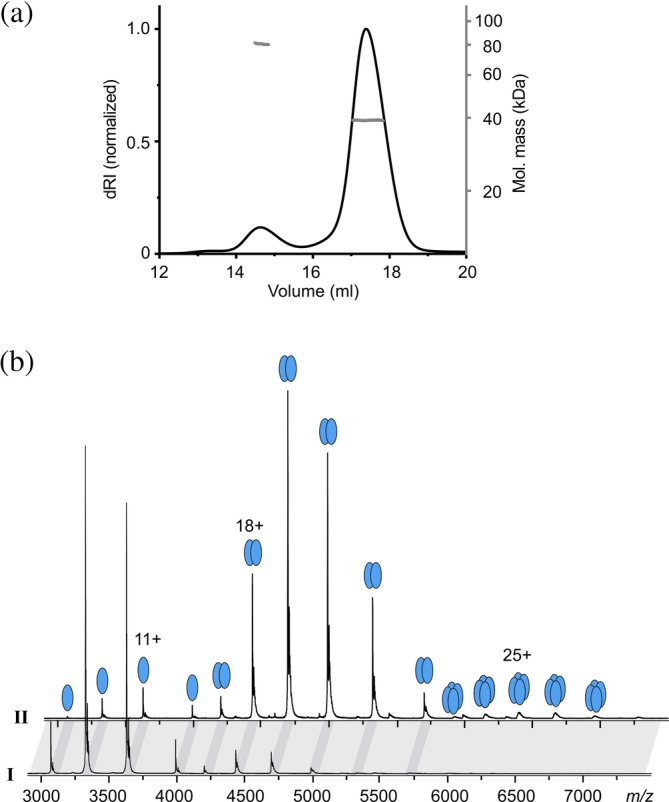
Stoichiometry of InvCΔ79. (a) SEC‐MALS analysis of InvCΔ79. The SEC profile (dRI, left axis) presents two elution peaks, I and II. The weight‐averaged molar masses (gray, right axis) across the elution peaks correspond to monomeric (40 kDa) and dimeric (80 kDa) states of InvCΔ79. (b) Representative native MS analysis of SEC‐peaks I and II demonstrating the monomeric (39,901.9 ± 0.6 Da) and dimeric state (79,808 ± 2 Da) of InvCΔ79, respectively. Dark gray bands highlight corresponding peaks from the two spectra. Masses are summarized in Table S1
