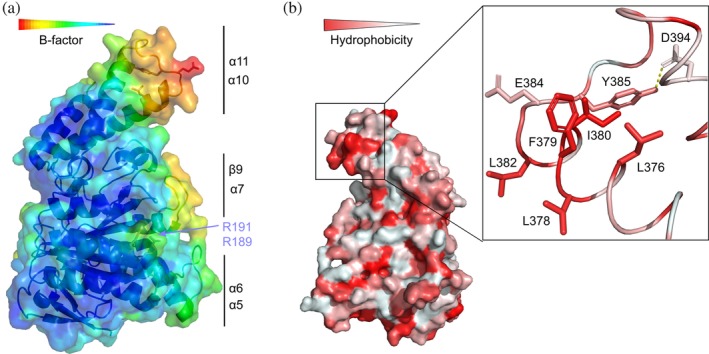
Figure 3.

Structural analysis of InvCΔ79. (a) Structure colored by B‐factor values. Color‐coding bar shows lower (blue) to higher (red) B‐factor values for rigid to mobile regions, respectively. Flexible loops and amino acids for intersubunit interaction are labeled as in Figure 2. (b) Structure depicted by 180° rotation colored by higher (red) to lower (white) hydrophobicity of amino acids. The hydrophobic patch containing L376 is shown as inlet. Y385 buried (forming hydrogen bonds with D394) and E384 exposed in the loop are also depicted in the inlet
