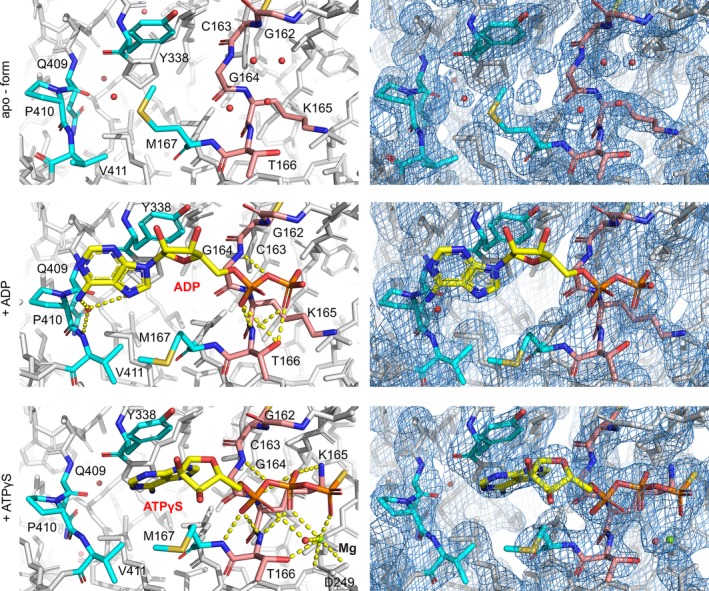
Figure 5.

Structural changes of the InvCΔ79 ATP‐binding site in the presence of ATP‐analogues. Analysis of ligand interaction (left column) and electron density maps with 2Fo‐Fc contour at 0.8–1.5σ (right column). P‐loop (G162 to T166) interacting with the phosphate groups is colored in light orange and other key amino acids for ligand recognition are colored in cyan. Contacts involved in ligand stabilization are indicated by yellow dashed lines. ADP, ATPγS, and magnesium ion are labeled
