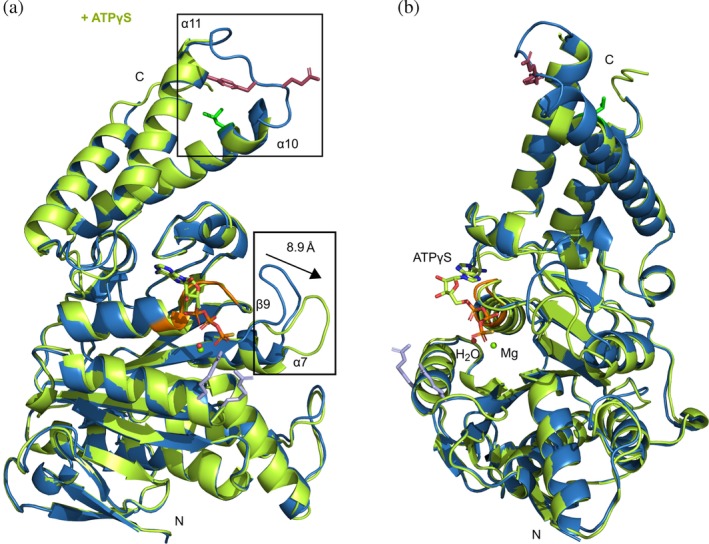
Figure 8.

Overall structural changes of InvCΔ79 in the presence of ATPγS. (A) 3D structural alignment of the apo‐form (blue) with the ATPγS bound form (lime). Differences in loop conformations are highlighted in rectangles and key amino acids colored as in Figure 2a. The β9‐α7 loop moves a distance of approximately 8.9 å. (B) 90° rotation view showing ATPγS interaction in the ligand‐binding site
