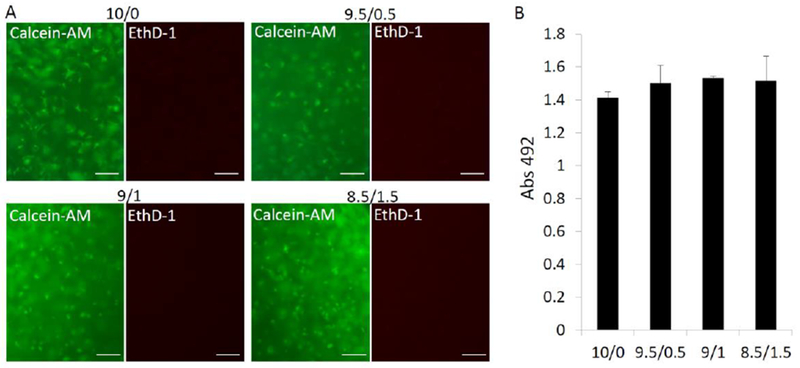
Figure 2.

Cell viability and number were estimated by live/dead staining (A) and an MTS assay, respectively. In A, live cells were stained to green using calcein-AM, and dead cells were stained to red using EthD-1. Bar=100µm; In B, no statistical difference was found (n=4).
