
Figure 4.
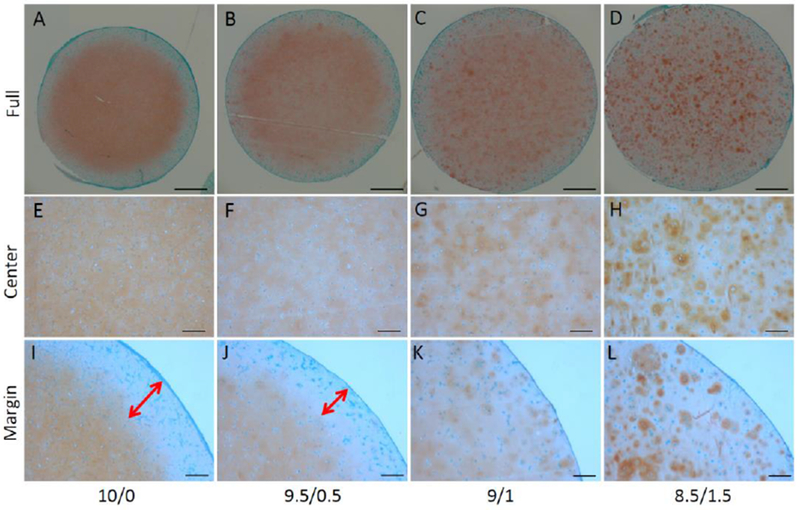
Safranin O staining was used to assess the matrix content and distribution of the constructs. Two-way arrows indicated the range of GAG-free zone, which was found only in the constructs from groups 10/0 and 9.5/0.5. Bar = 1mm in A-D; 200µm in E-L.