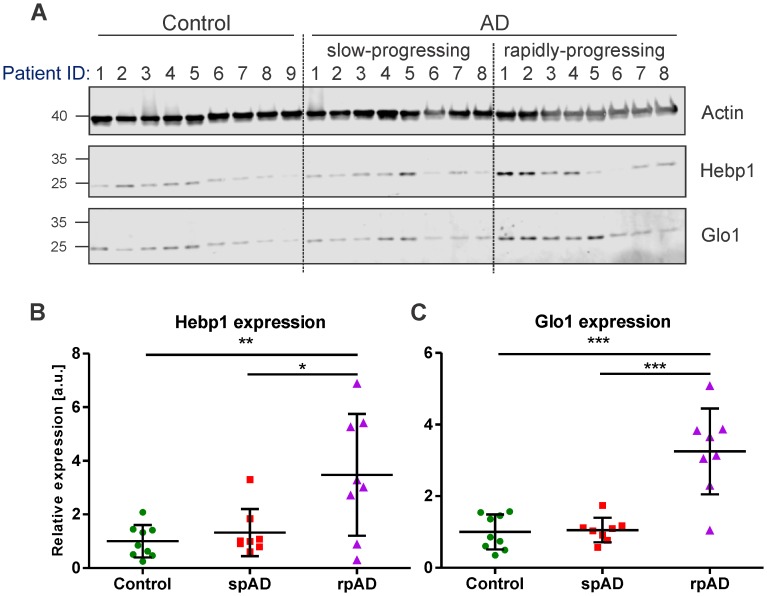
Figure 3. Hebp1 and Glo1 exhibit increased expression in brains of patients with rapidly-progressing forms of AD.
(A) Immunoblot analysis of Hebp1 and Glo1 expression in slow-progressing (spAD) and rapidly-progressing (rpAD) AD cases and age-matched controls. Samples from nine control, eight slow-progressing AD and eight rapidly-progressing AD patients were used in this study. Detailed information on the patients is presented in Table 2. Quantification of (B) Hebp1 and (C) Glo1 levels in human samples. Error bars in graphs represent mean ± SD. Statistical significance in the datasets was assessed by one-way ANOVA followed by Bonferroni’s multiple comparisons test for individual pairs of samples (α = 0.05): *p<0.025, **p<0.01, and ***p<0.0001.


