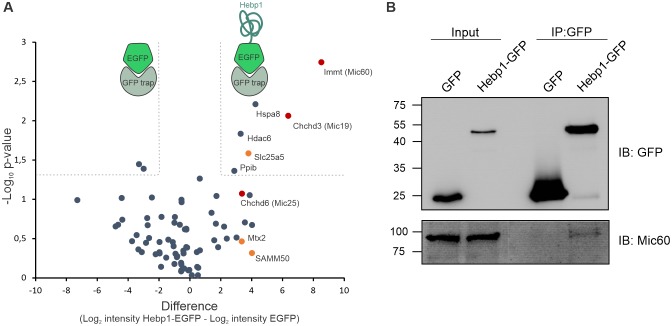
Figure 6. Hebp1 interactome reveals its association with mitochondrial contact site complex (MICOS).
(A) Hebp1 interactome obtained by mass spectrometry analysis of proteins co-immunoprecipitated from primary cortical neurons with Hebp1-EGFP or EGFP (negative control). Enrichment of mitochondria contacts site complex (MICOS) proteins (red) or MICOS-associated proteins (orange). Dashed line represents a cut-off for significantly different proteins between Hebp1-EGFP and control pulldown with at least 4-fold change. (B) Validation of Hebp1-Mic60 interaction by immunoblotting. All data shown are representative of results obtained from three independent experiments.

