. 2019 Sep 10;8:e47492. doi: 10.7554/eLife.47492

Figure 1. Study design and stimuli.

(A) The design of the study. In each block, subjects viewed one target item in a specific scale and location, and then performed four proximity comparisons for pairs of other items from the same location. All stimuli were provided by the subjects from locations personally familiar to them, and target and comparison items were chosen randomly from the subject’s stimulus set. (B) Examples of stimuli (subject-provided locations and items) in each spatial scale.

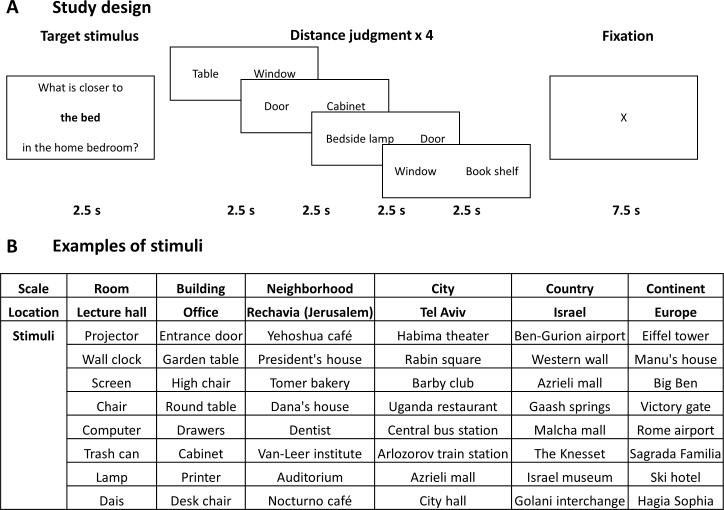
Figure 1.

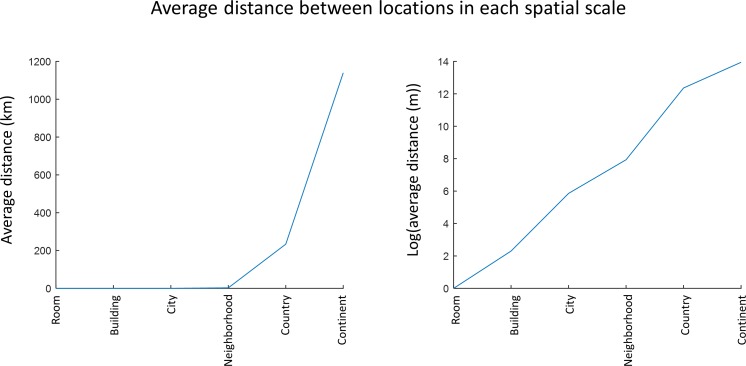
Figure 1—figure supplement 1. increase in size of spatial scales.

Figure 1—figure supplement 1.

The latitude and longitude coordinates of subjects’ provided stimuli were identified, and the distances between all stimuli pairs were calculated. Distances of 1 m between objects in a room and 10 m between objects in a building were assumed. The distances can be seen to reflect an approximately logarithmic increase between the scales.

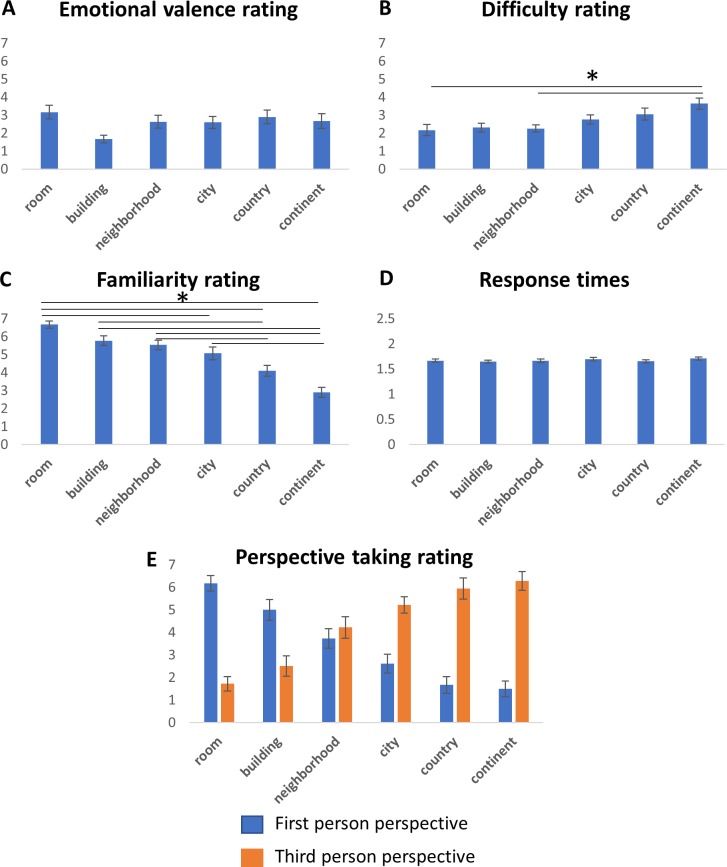
Figure 1—figure supplement 2. Behavioral results.

Figure 1—figure supplement 2.

Subjects ratings of emotional valence (A), difficulty (B), familiarity (C) and use of first or third person perspective (E) for each location used in the experiment, and average subjects response times (seconds) in each condition (D). Error bars represent standard errors across subjects. Asterisks represent significant differences between scales (p<0.01, one-way ANOVA, Tukey-Kramer post-hoc test).