. 2019 Sep 10;8:e47492. doi: 10.7554/eLife.47492

Figure 2. Small to large spatial scales preferentially activate regions along continuous posterior-anterior gradients.

Three cortical gradients were observed demonstrating a continuous shift in spatial scale selectivity. Within each gradient, posterior regions were selectively active for smaller spatial scales, and anterior ones for larger spatial scales. Colors indicate Gaussian fit peak scale position (voxels identified by ANOVA across beta values, p<0.01, FDR-corrected for multiple comparisons, minimum r2 of fit = 0.7). (A) Medial parietal gradient, (B) Medial temporal gradient, (C) lateral occipito-parietal gradient. (D) 3D visualization of the two medial gradients (gradients marked by dashed arrows, other activations not shown). (E) change in average spatial scale selectivity along the posterior-anterior axis of each gradient and along the hippocampal long axis (X axis represents MNI coordinates from posterior to anterior, blue – average position of a Gaussian fit peak for all scale-sensitive voxels at each coordinate, red – average position of scale with maximum activity for all scale-sensitive voxels at each coordinate). RH – right hemisphere, LH – left hemisphere. Full volume maps of these results are available online at https://github.com/CompuNeuroPsychiatryLabEinKerem/publications_data/tree/master/spatial_scales (Peer et al., 2019, copy archived at https://github.com/elifesciences-publications/publications_data).

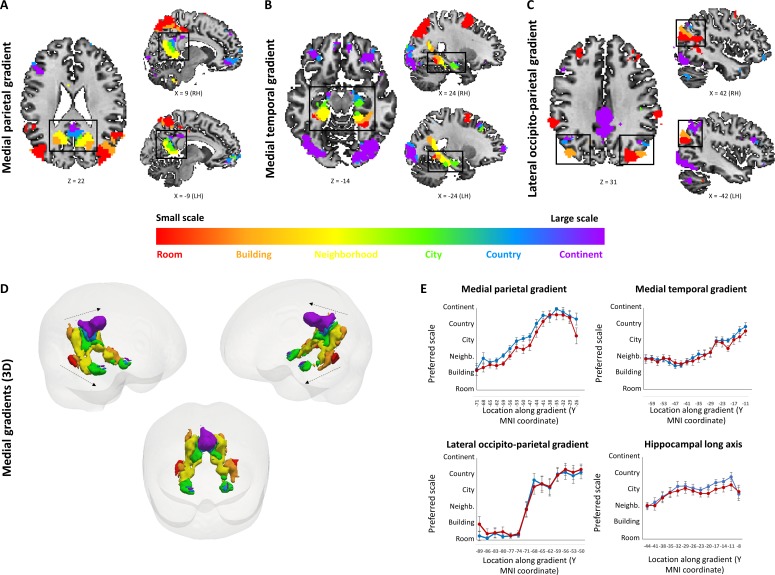
Figure 2.

Figure 2—figure supplement 1. Main data analysis pipeline.

Figure 2—figure supplement 1.

(A) The structure of each block of the task. Subjects are presented with a target stimulus, to which they have to compare four pairs of stimuli. (B) The data analysis pipeline. After pre-processing of the functional data, a GLM was fitted at each voxel with predictors for each spatial scale. ANOVA analysis was then applied on the resulting beta values to identify voxels with scale-selective activity. Finally, the scale with maximal response has been chosen for each scale-sensitive voxel. Additionally, a Gaussian function was fitted to the beta graph at each voxel, and its peak was selected as the voxel’s preferred scale, to identify selectivity when considering the overall pattern of activity across all scales.
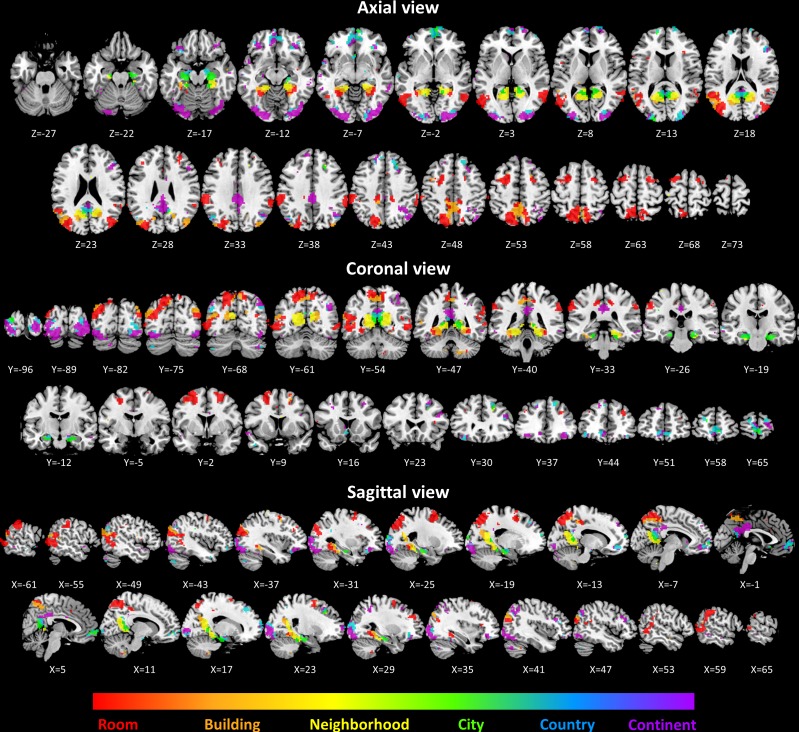
Figure 2—figure supplement 2. Volume view of all scene-selective activations.

Figure 2—figure supplement 2.

Colors represent the spatial scale at the position of Gaussian fit peak.
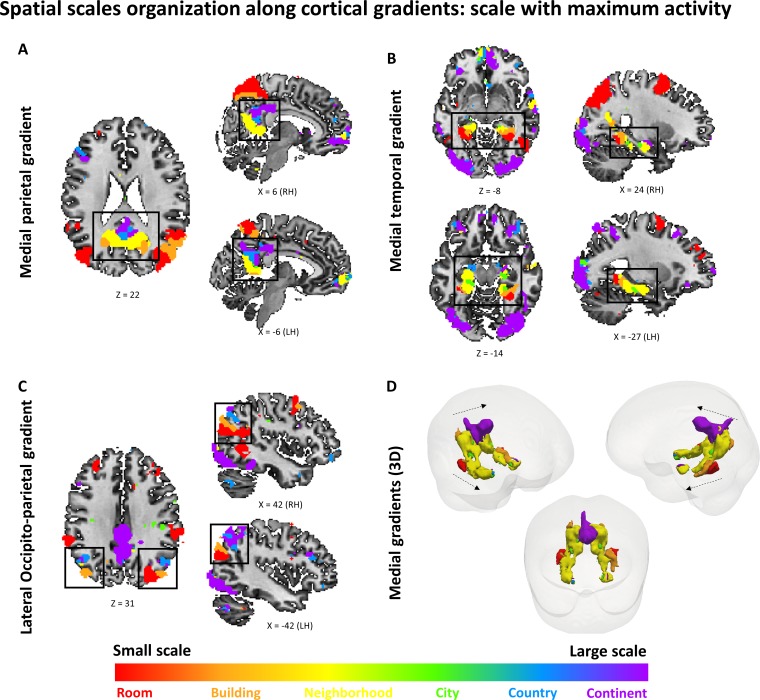
Figure 2—figure supplement 3. Gradients of spatial scale selectivity – scale with highest activity (beta value) at each voxel.

Figure 2—figure supplement 3.

Colors correspond to the scale with the highest beta value at each voxel. The posterior-anterior organization of spatial scales along the three gradients is observed here, although the regions with preference to the city and country scales are much less prevalent. Scale-sensitive voxels identified by ANOVA across subjects on the beta values for scale-specific regressors (p<0.01, FDR-corrected), with preferred scale determined by the maximal beta value at each voxel. (A) medial parietal gradient, (B) medial temporal gradient, (C) lateral occipito-parietal gradient, (D) 3D visualization of the two medial gradients (gradients marked by dashed arrows, other activations not shown). RH – right hemisphere, LH – left hemisphere. Full volume maps of these results are available online at https://github.com/CompuNeuroPsychiatryLabEinKerem/publications_data/tree/master/spatial_scales (Peer et al., 2019, copy archived at https://github.com/elifesciences-publications/publications_data).
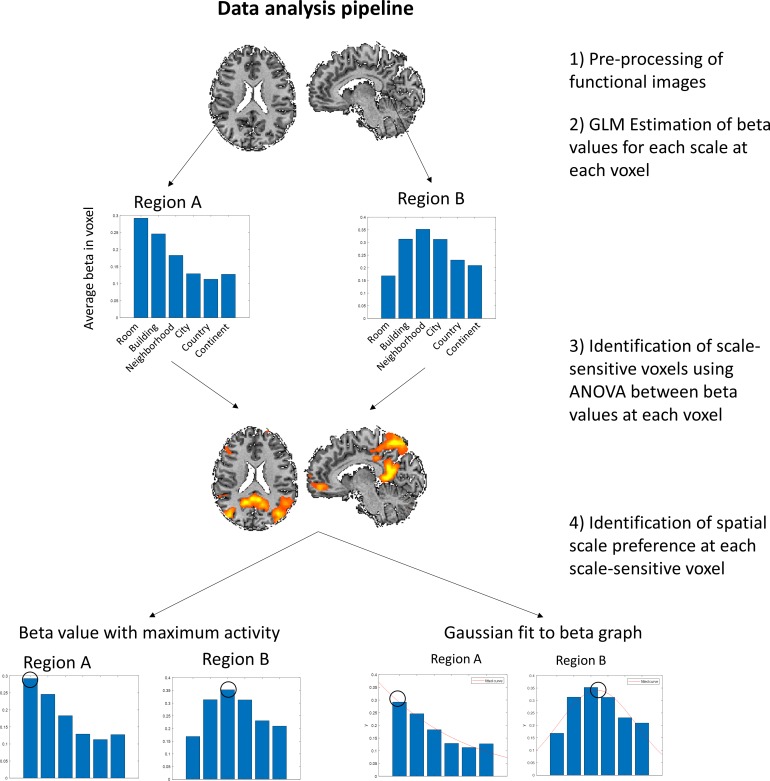
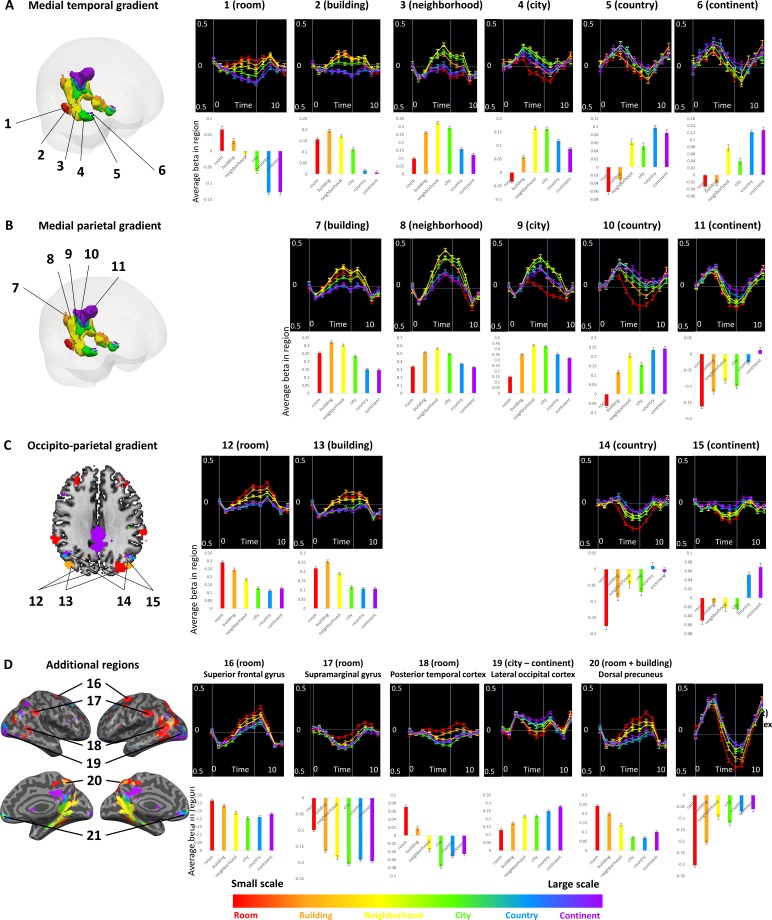
Figure 2—figure supplement 4. Activity profiles for spatial scale-sensitive regions.

Figure 2—figure supplement 4.

For each region with a specific scale sensitivity, the activity profile (averaged across subjects) is presented, where 0 indicates the beginning of the experimental block. Below each graph the fitted GLM beta values for scale-specific regressors are presented. Error bars represent standard error across subjects. (A) medial temporal gradient, (B) medial parietal gradient, (C) lateral occipito-parietal gradient, (D) additional regions of interest.
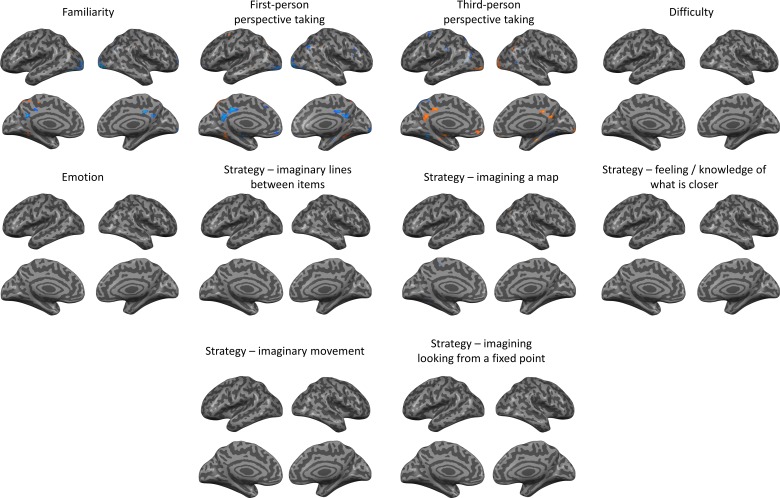
Figure 2—figure supplement 5. Effects of different potential contributing factors.

Figure 2—figure supplement 5.

Subjects ratings of each location and scale were used to create parametrically modulated regressors, to investigate the possible contribution of these factors to the spatial scales effect.