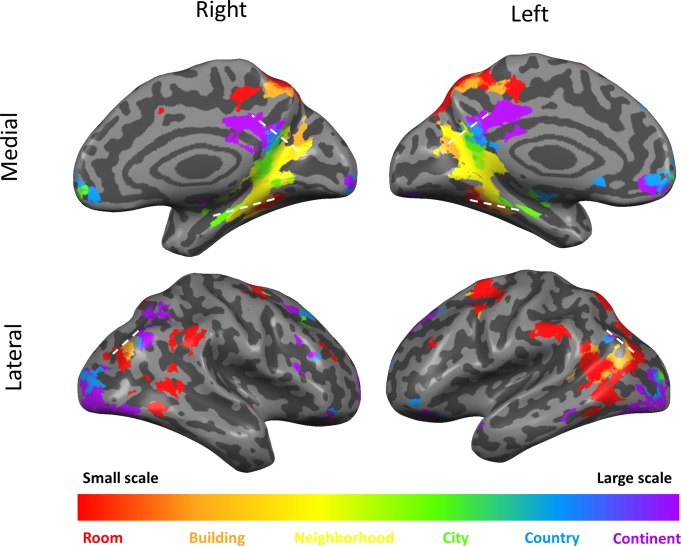
Figure 3. Scale-selective activity along gradients and additional cortical regions.
Surface view of all scale-selective cortical activations (including regions outside of the three gradients; voxels identified by ANOVA across beta values, p<0.01, FDR-corrected for multiple comparisons, minimum r2 of fit = 0.7, cluster threshold = 15 mm2). Continuous scale-sensitive gradients are marked by white dashed lines. Full volume maps of these results are available online at https://github.com/CompuNeuroPsychiatryLabEinKerem/publications_data/tree/master/spatial_scales (Peer et al., 2019, copy archived at https://github.com/elifesciences-publications/publications_data).

