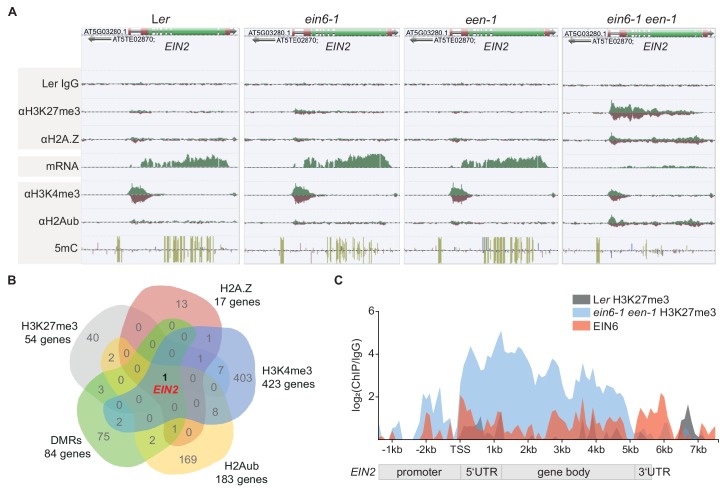
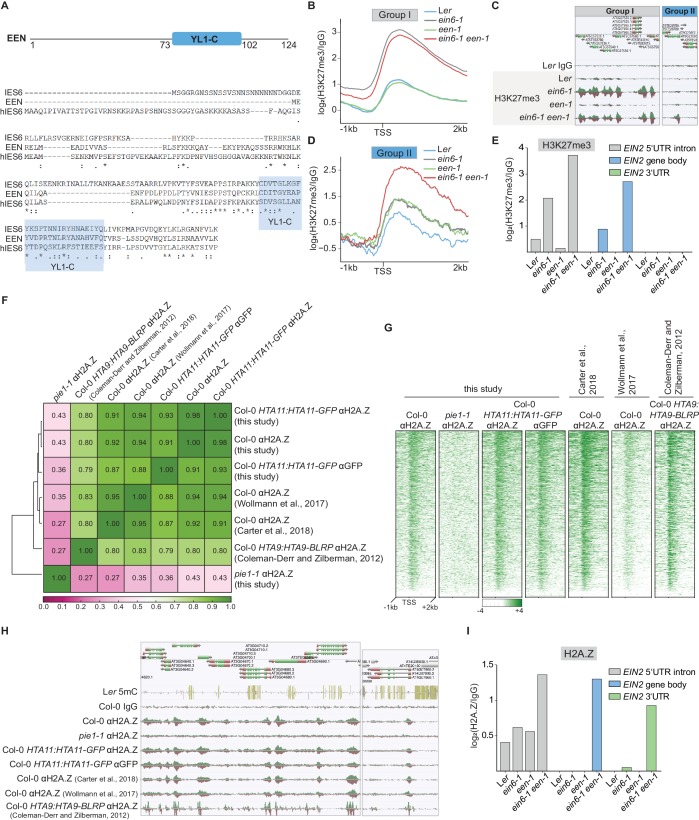
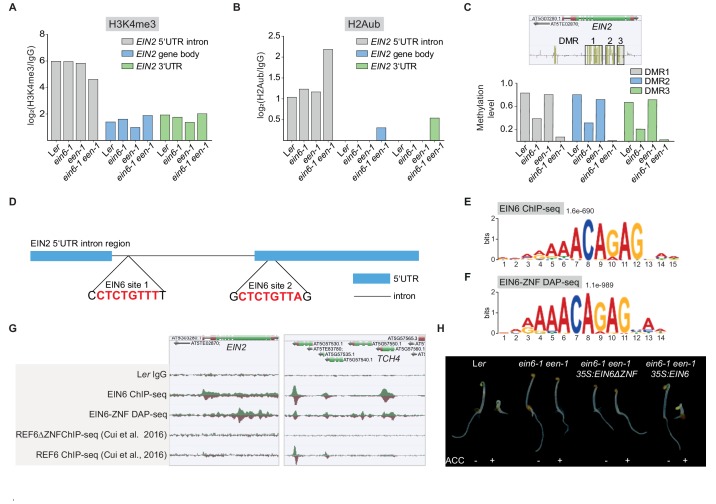
Figure 2. A repressive chromatin environment at EIN2 down-regulates its expression.
(A) Genome browser screenshot visualizes the levels of the depicted chromatin features at the EIN2 gene in untreated 3-day-old etiolated Ler, ein6-1, een-1 and ein6-1 een-1 seedlings. Occupancy of H3K27me3, H2A.Z, H3K4me3 and H2Aub was determined with ChIP-seq, mRNA expression was measured with RNA-seq and levels of methylated cytosines (CG in yellow, CHG in blue, CGG in pink) were determined with MethylC-seq. To ensure an accurate comparison of individual chromatin features between genotypes, the tracks were normalized to the respective sequencing depth. Normalization was separately done for each chromatin feature. Biological replicate 1 of the H3K27me3 and H2A.Z ChIP-seq datasets is shown. (B) Venn diagram illustrates the overlap between genes that show a significant increase of H3K27me3 (2-fold enrichment over ein6-1), H2AZ (2-fold enrichment over een-1) and H2Aub (2-fold enrichment over Ler) in ein6-1 een-1 mutants and also a significant decrease of H3K4me3 (1.5-fold enrichment in Ler over ein6-1 een-1). In addition, genes that contain differentially methylated regions (DMRs) with ten or more methylated cytosines in at least one genotype were included as well. (C) Graphical illustration of H3K27me3 and EIN6 occupancy at the EIN2 gene determined with ChIP-seq. Sequencing reads were merged between biological replicates for the H3K27me3 ChIP-seq using untreated 3-day-old etiolated Ler (gray) and ein6-1 een-1 (blue) seedlings (two replicates each) and the EIN6 ChIP-seq (red) using Ler 35S:EIN6-FLAG seedlings (three replicates). The occupancy was calculated as the ratio between the respective merged ChIP and the merged Ler IgG control in 100 bp bins from 2.4 kb upstream to 7.7 kb downstream of the transcriptional start site (TSS) of EIN2 and is shown as log2 fold change. Negative values which reflect lower occupancy in the ChIP sample compared to the IgG control sample were set to zero.


