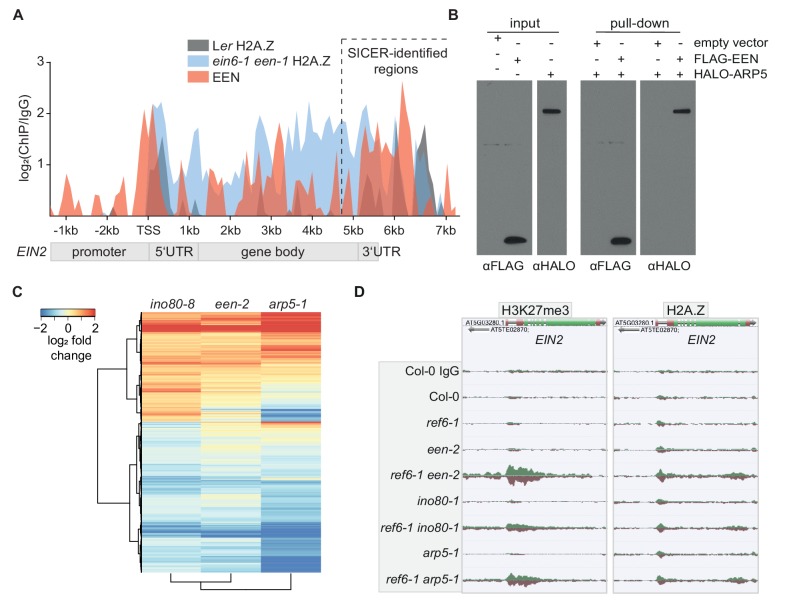
Figure 3. EEN is a subunit of the INO80 chromatin remodeling complex.
(A) Graphical representation of H2A.Z and EEN occupancy at the EIN2 gene determined with ChIP-seq. Sequencing reads of two merged H2A.Z ChIP-seq’s (Ler (gray), ein6-1 een-1 (blue)) and one EEN ChIP-seq (Col-0 35S:EEN-FLAG (red)) using 3-day-old etiolated seedlings were used. The occupancy is displayed as log2 fold change and was calculated as the ratio between the respective ChIP and the respective IgG control in 100 bp bins from 2.4 kb upstream to 7.7 kb downstream of the transcriptional start site (TSS) of EIN2. Occupancies that were lower in the ChIP sample compared to the IgG sample were set to zero. The region with significant EEN enrichment determined with SICER is indicated as well. (B) FLAG-pull-down assays using FLAG-tagged EEN and Halo-tagged ARP5 that were in vitro translated in rabbit reticulocyte extract. Anti-FLAG and anti-Halo antibodies were used to confirm EEN/ARP5 expression, EEN immunoprecipitation and EEN-ARP5 interaction. (C) Heatmap illustrates the log2 fold change in mRNA expression of INO80-dependent genes in untreated 3-day-old etiolated ino80-8, een-2 and arp5-1 seedlings relative to their expression in Col-0 seedlings. INO80-dependent genes were selected as genes that show a significant differential expression in ino80-8 mutant seedlings compared to Col-0 seedlings (787 genes up, 1079 genes down). (D) Genome browser screenshot shows the occupancy of H3K27me3 (right) and H2A.Z (left) at the EIN2 gene in untreated 3-day-old etiolated Col-0, ref6-1, een-2, ref6-1 een-2, ino80-1, ref6-1 ino80-1, arp5-1 and ref6-1 arp5-1 seedlings. Genome-wide occupancy of H3K27me3 and H2A.Z was determined by ChIP-seq. To ensure an accurate comparison of individual chromatin features between genotypes, the tracks were normalized to the respective sequencing depth. Normalization was separately done for each chromatin feature.


