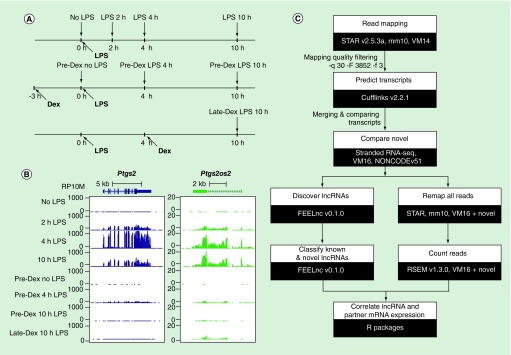
Figure 1. . Study design and analysis workflow.
(A) The experimental design of the cell culture used in the original study. The vertical black arrows indicate time points for RNA extractions followed by RNA sequencing. (B) A track view of an example of correlated mRNA and lncRNA genes from the University of California, Santa Cruz Genome Browser (http://genome.ucsc.edu).
(C) The analysis flow chart used for this study.
Dex: Dexamethasone; LPS: Lipopolysaccharide.

