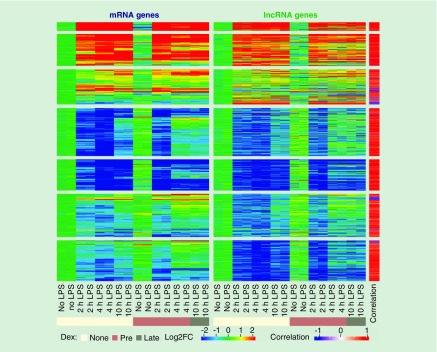
Figure 3. . The heatmap showing the expression profiles of 797 correlated mRNA and lncRNA gene pairs.
The color in the main heatmap represents the log2 fold change relative to the mean of the two control samples from unstimulated cells, calculated based on (FPKM + 0.1) gene expression values. An additional bar on the right side of the heatmap shows the Pearson’s correlation coefficients between the expression of lncRNA:mRNA pairs.
LPS: Lipopolysaccharide.

