Fig. 6.

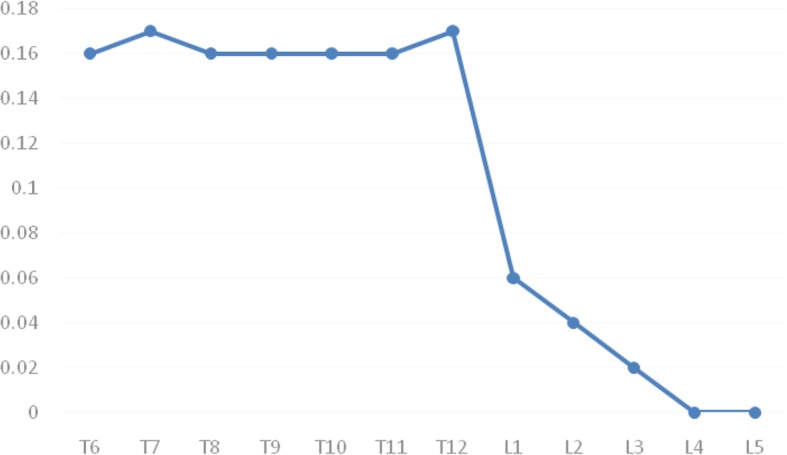
Trend chart of the PVWCD/VBSD ratios. The PVWCD/VBSD ratios were maintained at approximately 0.16 from T6 to T12, significantly reduced from T12 to L1, and gradually reduced to almost 0 from L1 to L5

Trend chart of the PVWCD/VBSD ratios. The PVWCD/VBSD ratios were maintained at approximately 0.16 from T6 to T12, significantly reduced from T12 to L1, and gradually reduced to almost 0 from L1 to L5