
Fig. 1.
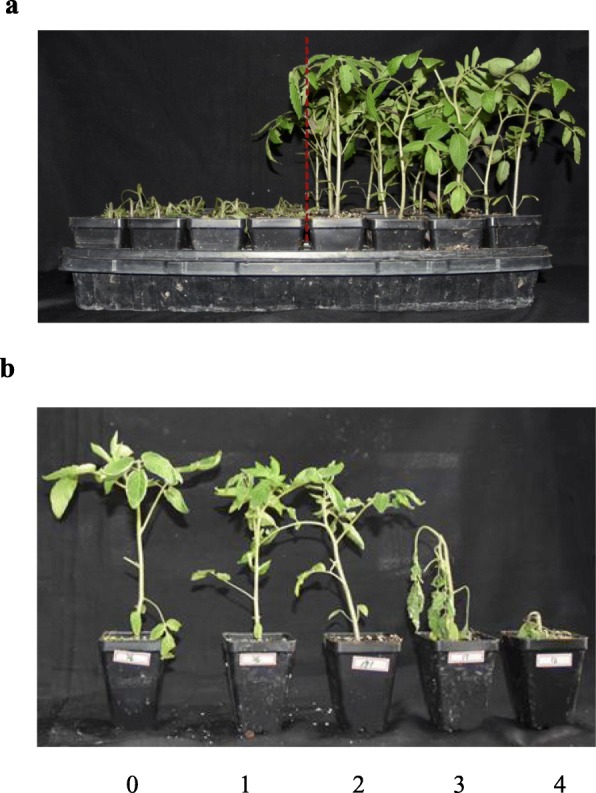
Identification of heat injury index in the F2 population. (a) The high-quality genomic DNA isolated from leaves of 20 each of the heat-sensitive (the plants at the left of the dotted line) and heat-tolerant (the plants at the right of the dotted line) mapping individuals was pooled at an equal ratio (amount) to constitute an HSB (Heat-sensitive bulk) and HTB (Heat-tolerant bulk) sample, respectively. (b) The heat injury degree of the F2 population was visually scored with the scale criterion from 0 to 4. The score of 0 meant no obvious heat damage on plants; The score of 1 meant the plant had few leaves wilted and slightly curled at edge; The score of 2 indicated that the plant had 3–4 leaves wilted and badly crimped at edge; The score of 3 represented that the whole plant wilted due to dehydration; The score of 4 described that the plant died