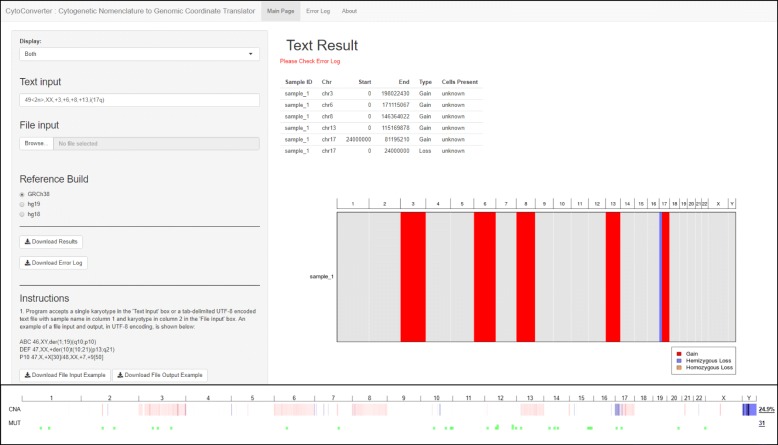
Fig. 2.
CytoConverter output from a cancer cell line. The top panel shows a screenshot of CytoConverter as applied to the karyotype of the cell line AML-193. The output produced by our web tool is under “Text Result”, wherein the sample is referred to as “sample_1” by default. The bottom panel shows the results from microarray-based copy number analysis of AML-193, as performed in Barretina et al. [1] and visualized using cBioPortal [3, 6]. In cBioPortal output, red indicates gains, blue indicates losses, and a darker color indicates a larger deviation from normal (i.e. a “deeper” deletion or higher-level amplification). Note that cBioPortal reports Y as having been lost, though the cell line is derived from a male patient with only X chromosomes constitutionally and therefore the Y chromosome was not present in the sample

