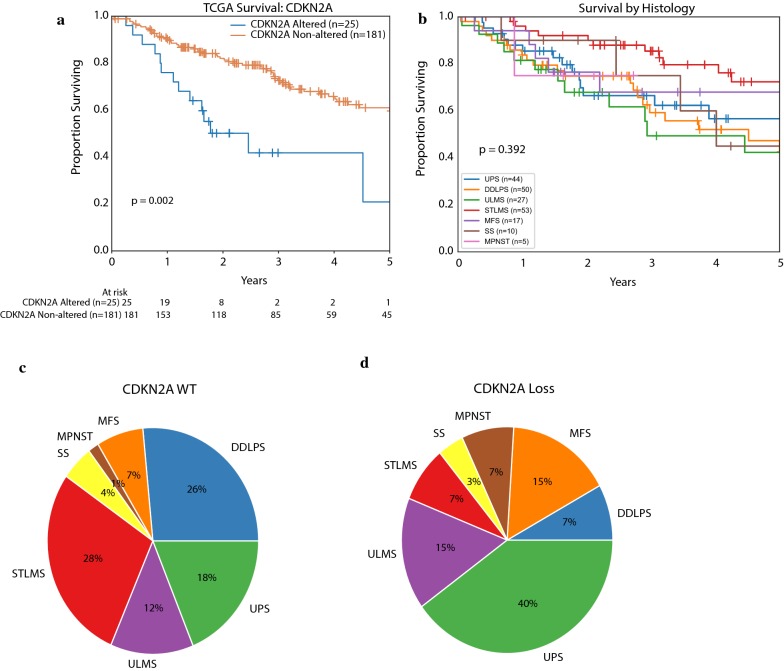
Fig. 3.
Clinical outcomes for TCGA soft tissue sarcoma patients (n = 206). a Kaplan–Meier curve of overall survival for CDKN2A altered versus non-CDKN2A altered patients (Cox Proportional Hazards adjusted for age, stage, and tumor size, p = 0.002). b Kaplan–Meier curve of survival by sarcoma histologies shows no significant difference in survival overall (p = 0.392). c Histologic distribution of patients who are CDKN2A wild type c versus CDKN2A altered d shows increase in proportion of MPNST, MFS, and UPS with decrease in LMS and DDLPS

