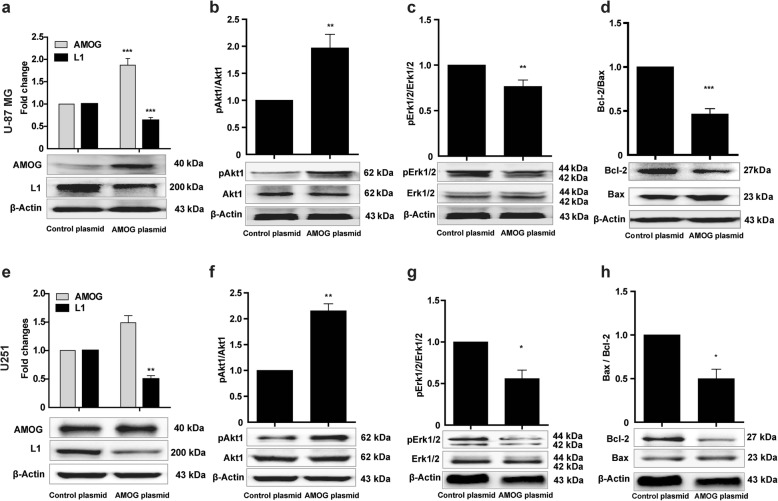
Fig. 6.
Over-expression of AMOG affects L1 expression and apoptosis-related signaling pathways. Western blot analysis of expression levels of L1 and AMOG (a, e), phosphorylated Akt1 (b, f) and Erk1/2 (c and g), and ratio of Bcl-2/Bax (d, h) in U-87 MG and U251 cells after transfection with an AMOG expression plasmid. Mean values ± SEM are from 3 independent experiments; independent Student’s t-test (*p < 0.05, **p < 0.01, and ***p < 0.001 versus the Control siRNA group)

