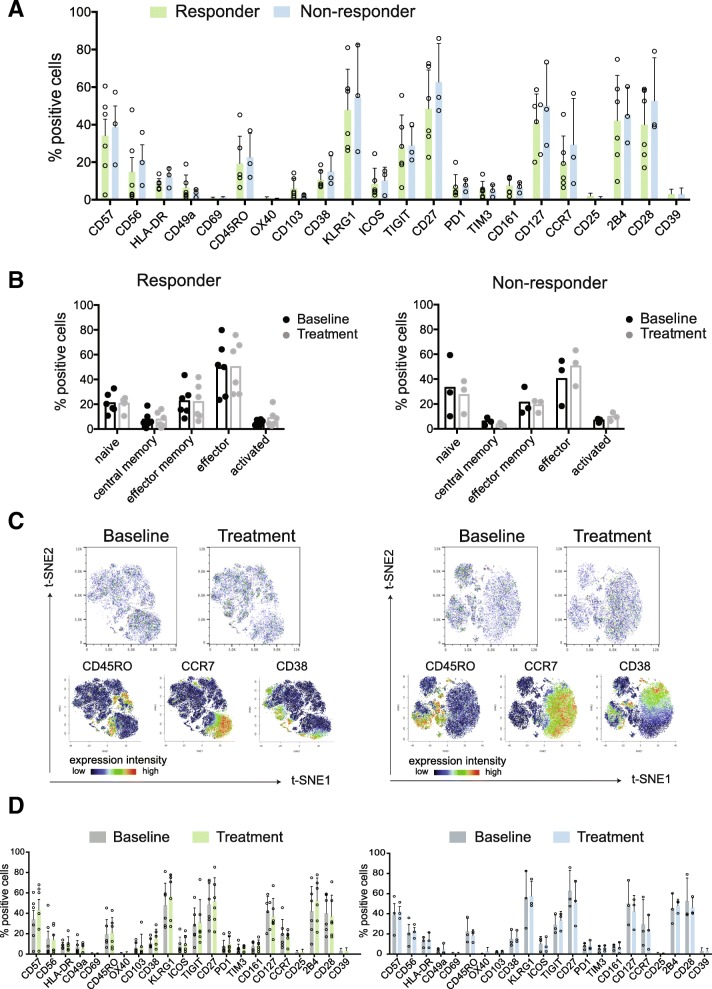
Fig. 1.
No difference in bulk CD8+ T cells phenotype at baseline or following treatment between atezolizumab responders and non-responders. a Frequencies of CD8+ T cells positive for all assessed marker molecules at baseline. b Frequencies of major CD8+ T cell subsets (naïve: CD45RO-,CCR7+; central memory: CD45RO+,CCR7+; effector memory: CD45RO+,CCR7-; effector: CD45RO-,CCR7-; and activated cells: CD38+/CCR7-) at baseline and on atezolizumab treatment. Each dot represents a patient. c Representative t-SNE map visualizing CD8+ T cells from one responder and one non-responder at baseline and on atezolizumab treatment with related plots showing relative position of cells expressing CD45RO, CCR7 and CD38. d Frequencies of CD8+ T cells positive for all analyzed markers at baseline and on atezolizumab treatment. Data shown from responders (green, n = 6) and non-responders (blue, n = 3)

