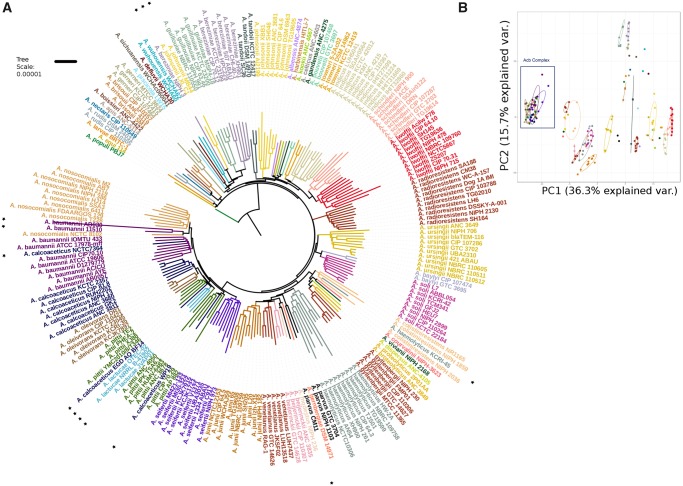
Fig. 2.
—(A) NJ approach analysis of gene composition. Strains belonging to the same species are colored equally, asterisks show misclassified strains and strains that are grouped differently in the Species Tree phylogeny. (B) PCoA approach. Biplot Dots share color code with (A) Acb complex is denoted with a black rectangle.

