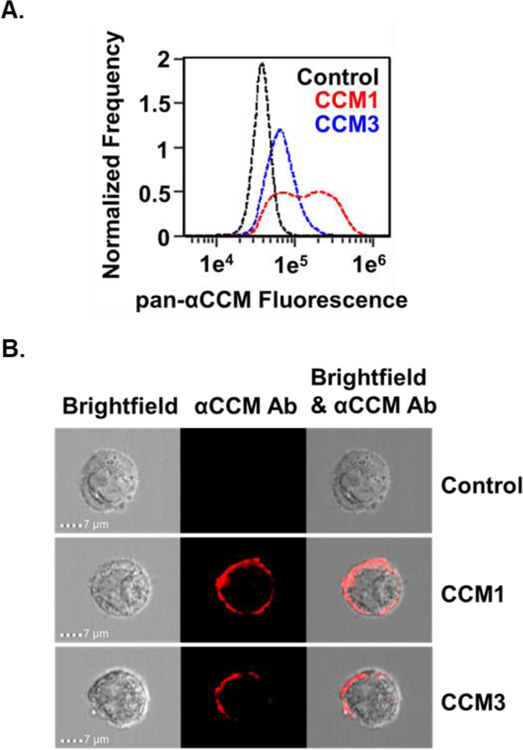
Figure 3.
Surface CEACAM expression on HeLa cells. (A) Control (black), CEACAM1 (red), and CEACAM3 (blue) HeLa cells were dissociated, fixed in 4% PFA, and stained with a pan-CEACAM antibody. Compared to control cells, histograms of fluorescence intensity show high fluorescence in CEACAM1 and CEACAM3 cells, with highest staining on CEACAM1 cells. (B) Merged images of pan-CEACAM antibody (red) staining and brightfield images of control, CEACAM1, and CEACAM3 cells show CEACAM localization at the cell surface.

