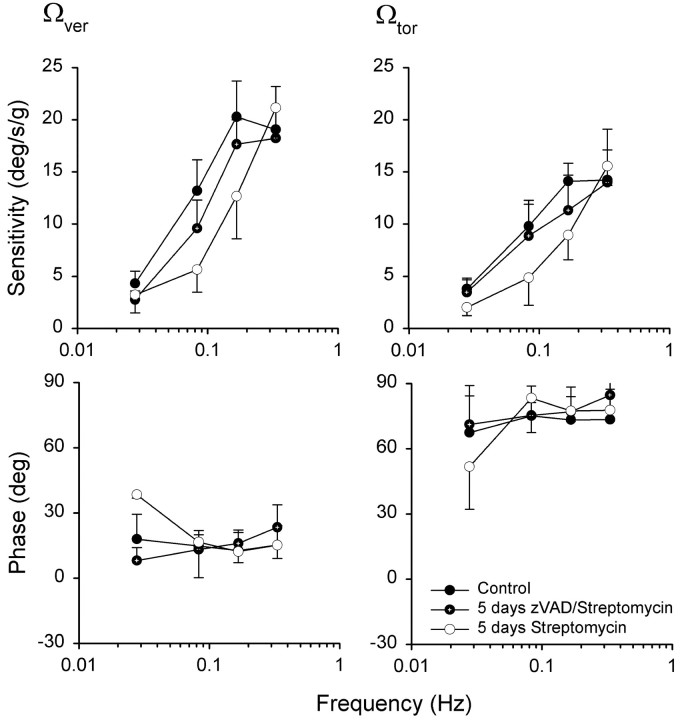
Figure 10.
Mean (±SD) vertical and torsional slow-phase sensitivity and phase values to OVAR stimulation as a function of frequency in streptomycin- and zVAD/streptomycin-treated animals. Mean sensitivity values (degrees per second divided by gravity) were calculated as slow-phase eye velocity/head acceleration for four animals. Phase values (degrees) are shown relative to linear acceleration. Each animal served as its own control.

