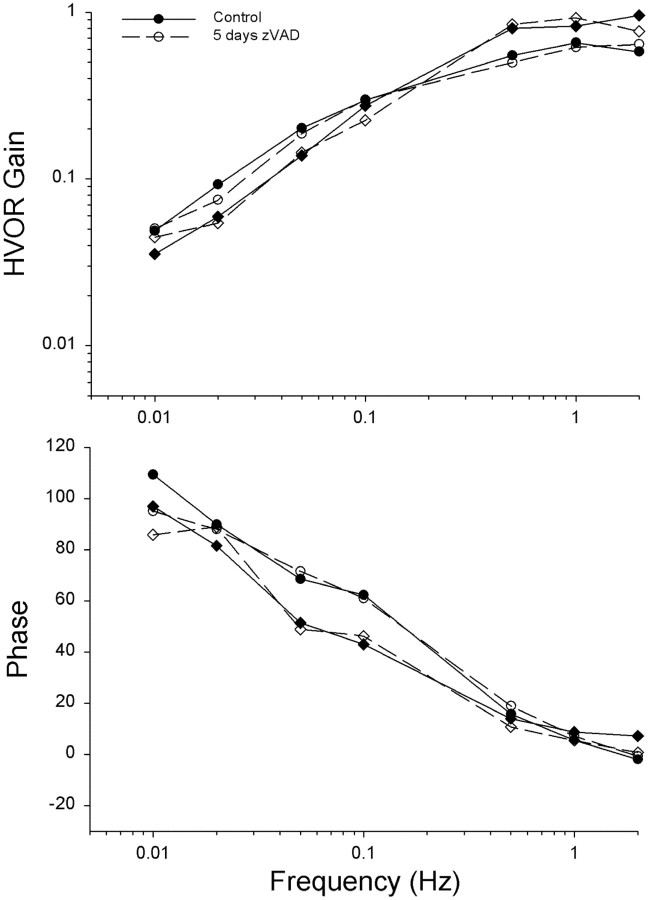
Figure 9.
Frequency response functions for the HVOR in animals treated with zVAD alone. Slow-phase eye velocity gain and phase values are plotted for pretreatment performance (open symbols) and after 5 d of zVAD treatment (closed symbols; n = 2 animals). Gain values are presented as eye velocity/head velocity and phase values as degrees lead relative to head velocity. Treatment with zVAD had no effect on either the gain or phase.

