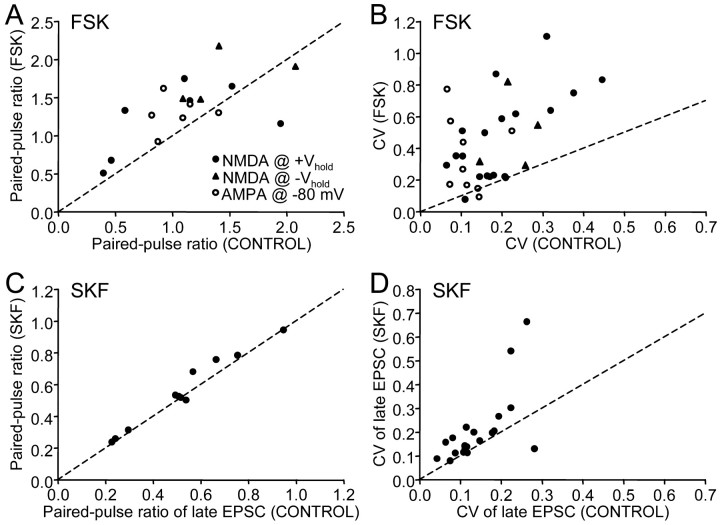
Figure 7.
Paired-pulse ratio and coefficient of variation of EPSC amplitude increased in the presence of forskolin (A, B) and SKF-38393 (C, D). A, C, Scatter-plot of paired-pulse ratios before and during forskolin and SKF-38393 application, respectively. Filled circles represent values measured from late EPSC size at positive holding potentials; filled triangles represent values from late EPSC size at negative holding potentials; open circles represent values from EPSC amplitude at -80 mV; dashed line represents a line with a slope of 1. Note that most data points lie above the line, indicating an increase in paired-pulse ratio in the presence of forskolin/SKF-38393. B, D, Scatter-plot of coefficients of variation before and during forskolin and SKF-38393 application, respectively. Note that most data points lie above the line.

