
Figure 3.
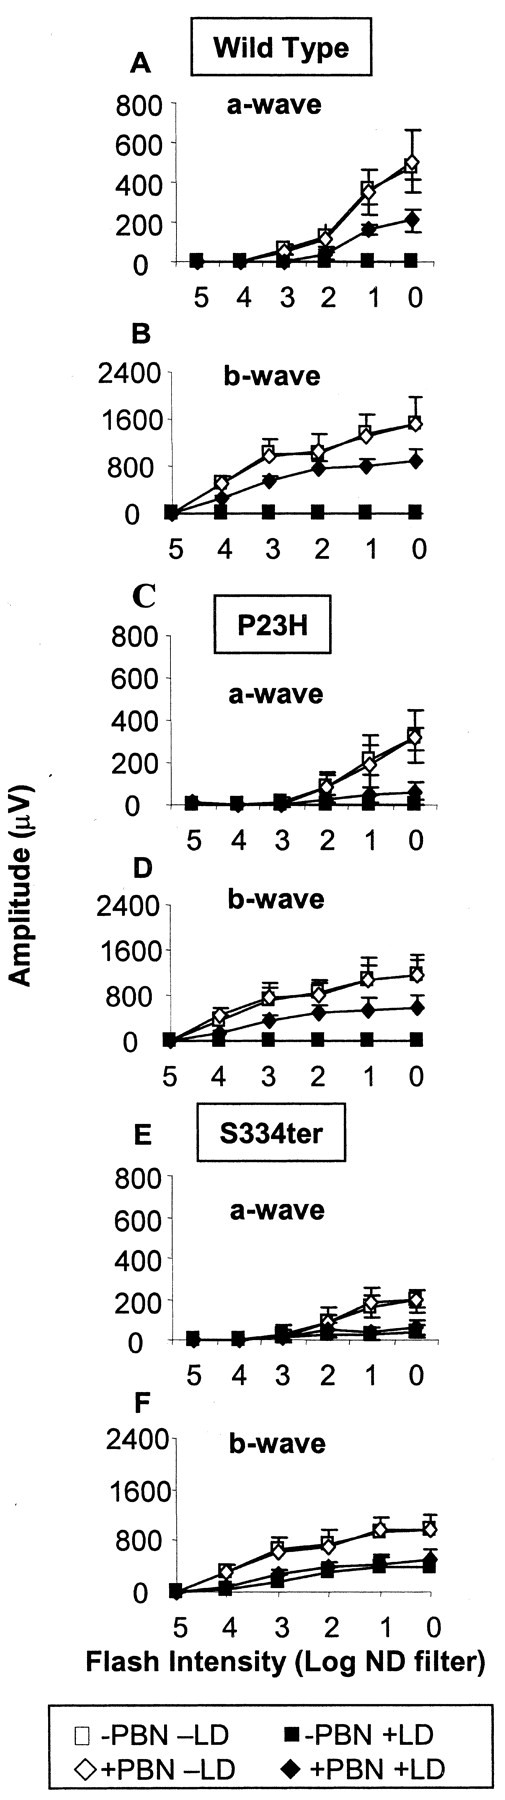
a-wave (A, C, and E) and b-wave (B, D, and F) sensitivity curves at P38–P41. The a-wave and b-wave amplitudes (in microvolts) are plotted as a function of the stimulus intensity [log neutral density (ND) filter] before (open symbols) and after (filled symbols) damaging light. Rats were untreated (squares) or treated with PBN (diamonds). LD, Light damage.