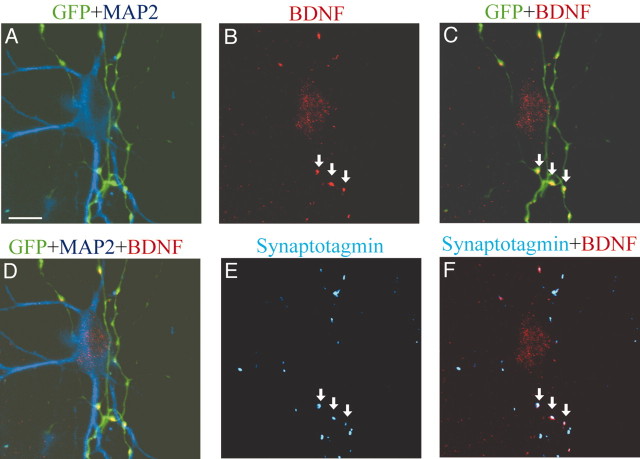
Figure 4.
Existence of endogenous BDNF in presynaptic axon terminals. A, Superposed image of GFP signals (green) and MAP2 signals (blue). B, BDNF image (red) of the same frame as A. The arrows show clusters of BDNF signals. Faint BDNF signal was seen in the soma of the postsynaptic neuron, as shown in D. C, Superposed image of GFP and BDNF. BDNF puncta were colocalized with GFP-positive neurites (arrows). D, Superposed image of GFP, MAP2, and BDNF. E, Synaptotagmin image of the same frame as the others. The arrows indicate the same puncta as in B, C, and F. F, Superposed image of synaptotagmin (blue) and BDNF (red). BDNF puncta indicated by arrows were colocalized with synaptotagmin. Scale bar: (in A) 10 μm.

