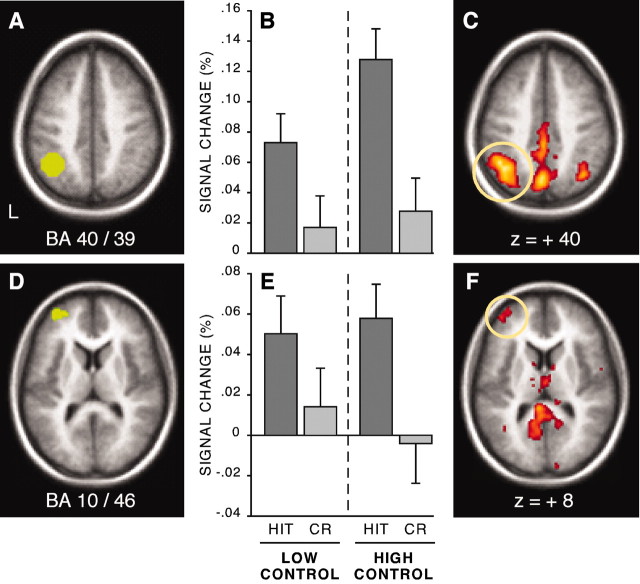
Figure 3.
Left parietal and left anterior frontal cortex increased activity for HIT trials versus correct rejection (CR) trials. A, A horizontal section shows the BA 40/39 region overlaid onto a standardized anatomical image (z=+40). B, Magnitude estimates of signal change in BA 40/39 for each condition. A significant HIT/CR difference was obtained in both control conditions. C, A horizontal section showing greater statistical activation at z = +40 for HIT trials than for CR trials in exploratory analyses. Thresholds are set at z = 3.29, p = 0.001, two tailed. D–F are similar in layout to A–C, respectively, except that the displayed region represents left anterior frontal cortex (z =+8).

