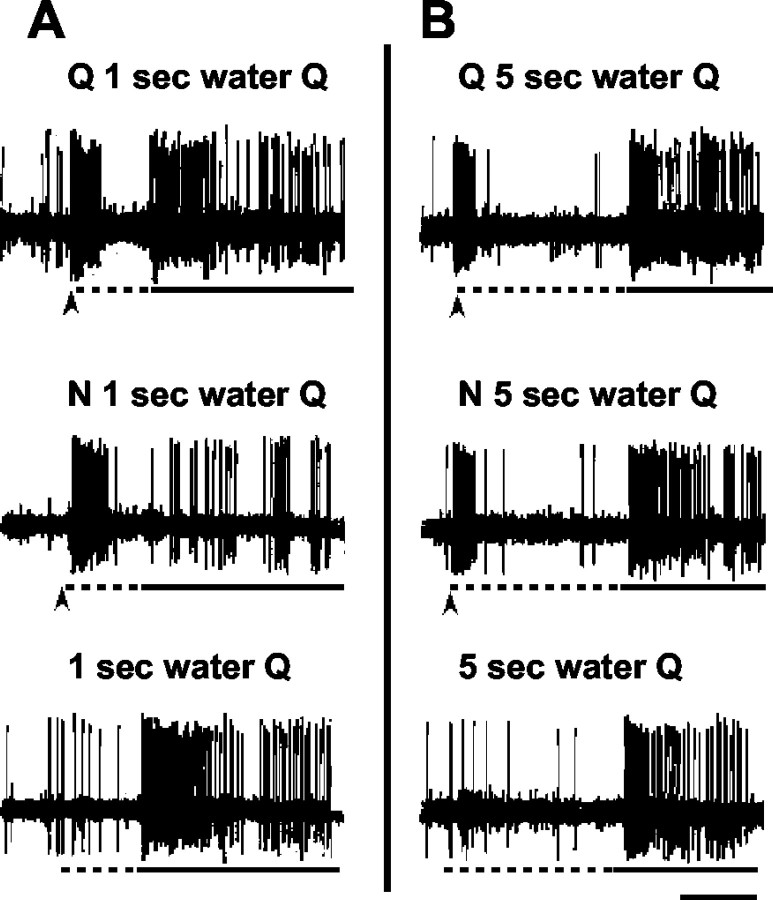
Figure 1.
Oscilloscope tracings from one cell. Arrow under each trace indicates onset of taste prepulse; dotted line under each trace indicates presentation of water rinse; solid line under each trace indicates stimulus presentation. Calibration bar (bottom right): A, 1 sec; B, 2 sec. A, Top, Response to a 100 msec quinine prepulse, followed by a 1 sec water rinse and a 3 sec quinine stimulus presentation. Middle, Response to a 100 msec NaCl prepulse, followed by a 1 sec water rinse and a 3 sec quinine stimulus presentation. Bottom, Response to a 1 sec water rinse, followed by a 3 sec quinine stimulus. B, Top, Response to a 100 msec quinine prepulse, followed by a 5 sec water rinse and a 3 sec quinine stimulus. Middle, Response to a 100 msec NaCl prepulse, followed by a 5 sec water rinse and 3 sec quinine stimulus. Bottom, Response to a 5 sec water rinse, followed by a 3 sec quinine stimulus.

