
Figure 3.
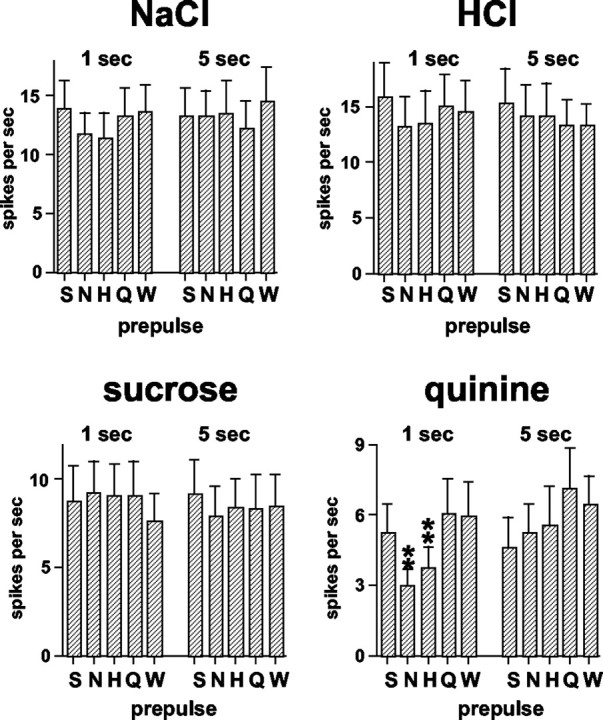
Mean ± SEM response rates (in spikes per second) to taste stimuli presented alone or preceded by taste prepulses. 1 sec, Prepulse-stimulus interval was 1 sec, during which a water rinse was presented. 5 sec, Prepulse-stimulus interval was 5 sec, during which a water rinse was presented. Letters along abscissa indicate the stimulus that was used as a prepulse. S, Sucrose; N, NaCl; H, HCl; Q, quinine; W, the response when the stimulus was preceded by a water rinse with no taste stimulus prepulse. *p < 0.05; **p < 0.01. For details of statistical analyses, see Results.