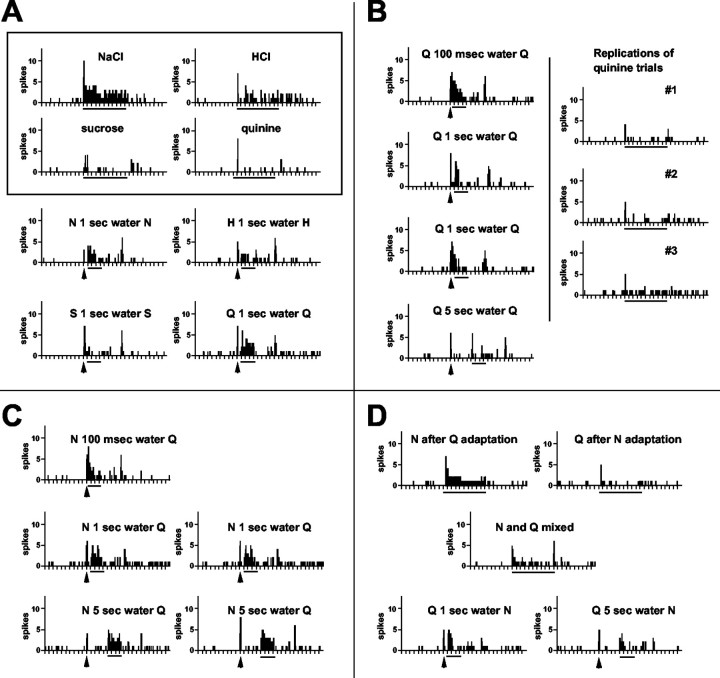
Figure 6.
Peristimulus time histograms of responses to taste stimuli in one unit showing the appearance of a response to quinine after prepulses of NaCl or quinine. Arrow under histogram indicates presentation of a 100 msec prepulse; line under each histogram indicates presentation of taste stimulus. A water rinse was always presented during the interval between the prepulse and the stimulus. Tick marks along the abscissa are time in seconds. S, Sucrose; N, NaCl; H, HCl; Q, quinine. A, Top, Enclosed in a box, Responses to all four taste stimuli presented initially for 10 sec without taste prepulses; bottom, responses to taste stimuli presented for 3 sec preceded by an autopulse. B, Left, Responses to quinine presented for 3 sec preceded at various intervals (as indicated) by an autopulse. Right, Responses to replications of quinine presentations for 10 sec without prepulses. These trials were interspersed at various points during the testing protocol. C, Responses to quinine preceded at various intervals (as indicated) by an NaCl prepulse. D, Top, Left, Response to a 10 sec NaCl presentation after adaptation of the tongue to quinine. Top, Right, Response to a 10 sec quinine presentation after adaptation of the tongue to NaCl. Middle, Response to a mixture of NaCl and quinine presented for 10 sec. Bottom, Responses to a 3 sec NaCl presentation preceded by 1 sec (left) or 5 sec (right) by a prepulse of quinine.

