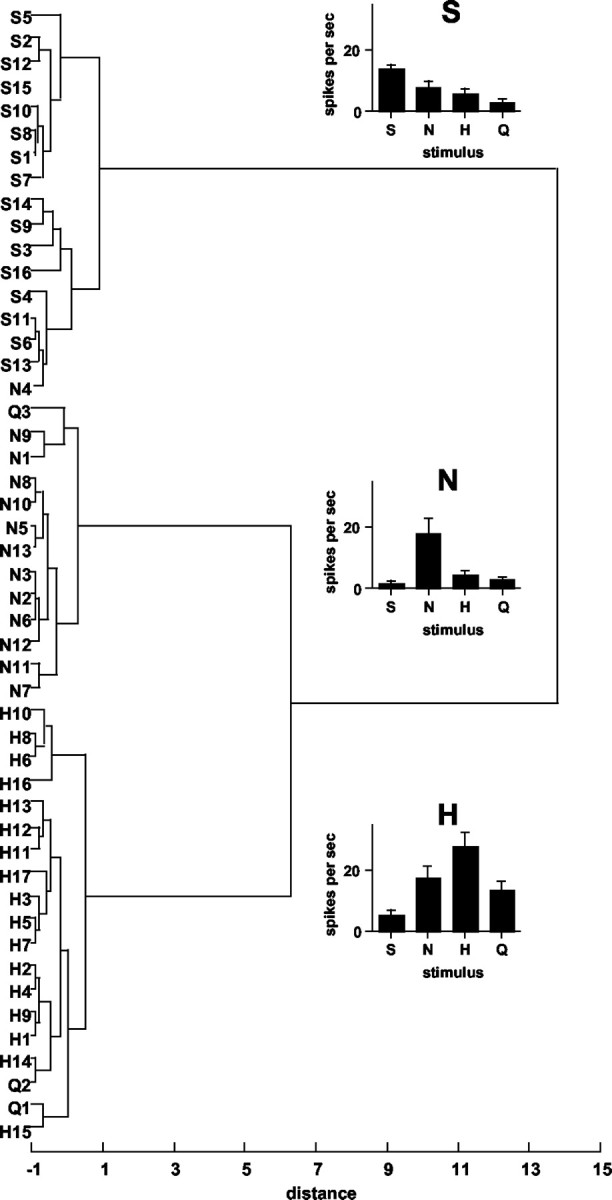
Figure 7.

Dendrogram showing results of HCA. Units are labeled according to their best stimulus and their relative response magnitude to that stimulus within the best stimulus category. For example, N3 is an NaCl best unit with the third highest response to NaCl among the NaCl best units. Distance scale indicates relative dissimilarity of response profiles. Graphs show mean response rates (in spikes per second) for units in each of three clusters. Responses to taste stimuli presented without taste prepulses are shown. S, Sucrose; N, NaCl; H, HCl; Q, quinine.
