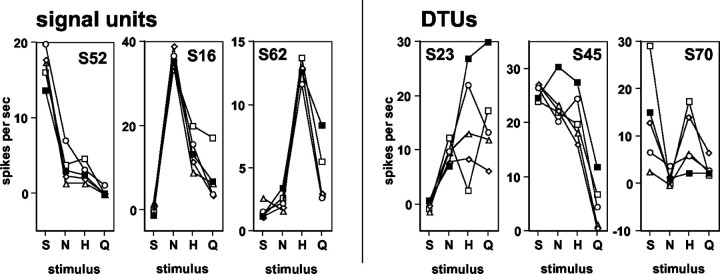
Figure 9.
Response profiles of three signal units (left) and three DTUs (right) when taste stimuli were presented without and after taste prepulses. Label at top of each graph indicates the identity of the unit. S, Sucrose; N, NaCl; H, HCl; Q, quinine. Filled squares, Responses when stimuli were presented without a prepulse; open circles, responses when stimuli were presented with a sucrose prepulse; open diamonds, responses when stimuli were presented with a NaCl prepulse; open triangles, responses when stimuli were presented with a HCl prepulse; open squares, responses when stimuli were presented with a quinine prepulse.

