
Figure 7.
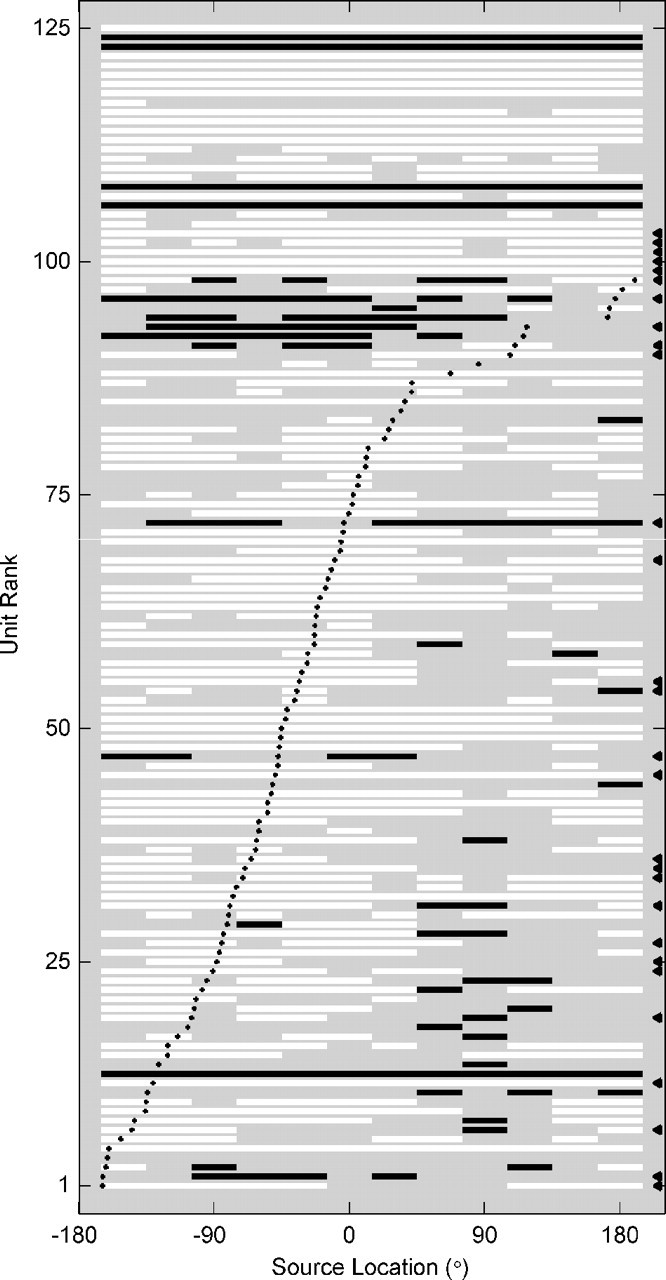
Enhancement and suppression in spatial receptive fields. Each row represents an SU (marked with a black triangle to the right) or an MU. Units are ranked from bottom to top by their best locations, which are indicated by solid black dots. Source location is represented along the abscissa. For each source location, we calculated the mean firing rate and the SEM. White bars signify source locations for which the mean firing rate was >2 SEs above the spontaneous rate (enhancement). Black bars indicate a mean firing rate >2 SEs below the spontaneous rate (suppression).