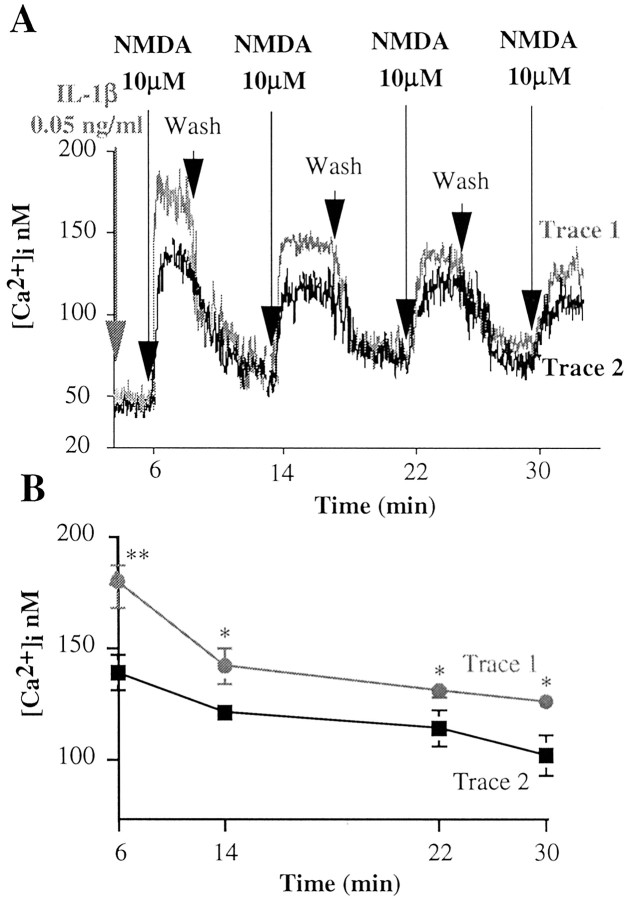
Figure 2.
Duration of the IL-1β effect on NMDA-induced [Ca2+]i increase. A, Trace 1 (gray) depicts a representative Ca2+ trace showing the response of hippocampal neurons to four consecutive applications of 10 μm NMDA, the first in the presence (6 min preincubation) and the following in the absence of 0.05 ng/ml IL-1β. Trace 2 (black) depicts a representative Ca2+ trace showing the response of hippocampal neurons to four consecutive applications of 10 μm NMDA done in the absence of IL-1β. Intracellular Ca2+ increase was determined by loading hippocampal neurons with fura-2 AM and measuring fura-2 fluorescence ratio signal in a double-wavelength fluorimeter. B, Average peak Ca2+ response to four consecutive applications of NMDA as reported in A. Values are the mean ± SE of 13 independent samples. **p < 0.01 and *p < 0.05 versus control; ANOVA followed by Tukey's test.

