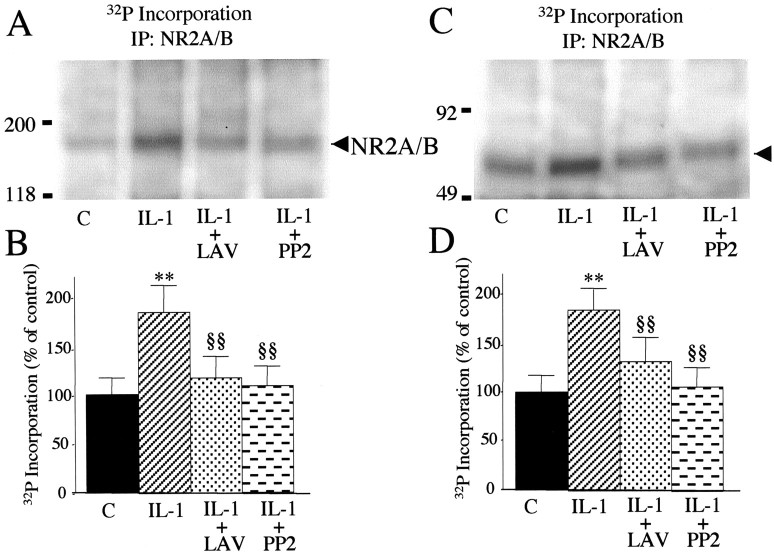
Figure 5.
IL-1β-induced phosphorylation of NR2A/B subunits through the Src family of tyrosine kinases. A, Metabolic labeling and immunoprecipitation of NR2A/B subunits. Hippocampal neurons were incubated for 30 min in HBSS plus 500 nm lavendustin A (LAV) or 1 μm PP2 and then exposed to 0.05 ng/ml IL-1β for 6 min. Controls (C) were hippocampal neurons incubated in HBSS for 36 min. B, Histogram shows the 32P incorporation in NR2A/B subunits in the various experimental conditions, expressed as percentage of control. Values were normalized as reported in Materials and Methods. Lavendustin and PP2 alone were not different from the control. Values are mean ± SE (n = 6). **p < 0.01 IL-1 versus control; §§p < 0.01 IL-1 + LAV and IL-1 + PP2 versus IL-1 by ANOVA followed by Tukey's test. C, Representative autoradiography showing the presence of a phosphorylated protein band of apparent molecular weight 65 kDa in anti-NR2A/B immunoprecipitates (arrowhead). Molecular weight standards are reported to the left. D, Histograms shows 32P incorporation in a 65 kDa phospho-band in the various experimental conditions, expressed as percentage of control. Values were normalized as reported in Materials and Methods. Lavendustin and PP2 alone were not different from the control. Values are mean ± SE (n = 6). **p < 0.01 IL-1 versus control; §§p < 0.01 IL-1 + LAV and IL-1 + PP2 versus IL-1 by ANOVA followed by Tukey's test.

