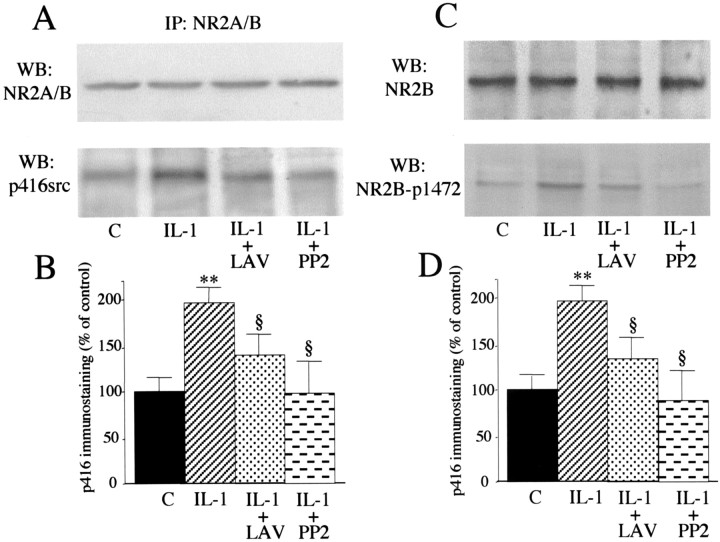
Figure 6.
IL-1β-induced phosphorylation of Src-Tyr-416 and NR2B-Tyr-1472. A, Proteins from hippocampal cell lysates were immunoprecipitated (IP) with a polyclonal antibody raised against NR2A/B. Western blot was done in the immunoprecipitated material using the NR2A/B antibody (top) or the phospho-specific p416Src antibody (bottom). Histograms in B show the quantification of the Tyr416-phosphorylated Src coimmunoprecipitated with the NR2A/B subunits. Data are normalized for NR2A/B immunoreactivity. Values are mean ± SE of two independent experiments (**p < 0.01 IL-1 vs control; §p < 0.05 IL-1 + LAV and IL-1 + PP2 vs IL-1; ANOVA followed by Tukey's test). C, Representative Western blot depicting increased phosphorylation of NR2B-Tyr-1472 after exposure to IL-1 β (bottom). D, Quantification of Tyr-1472 phosphorylation in the various experimental conditions. Data are normalized for NR2A/B immunoreactivity (top) in the respective samples, which did not differ among treatments. Values are mean ± SE (n = 6) obtained from two experiments, each including three independent samples (**p < 0.01 IL-1 vs control; §p < 0.05 IL-1 + LAV and IL-1 + PP2 vs IL-1; ANOVA followed by Tukey's test).

