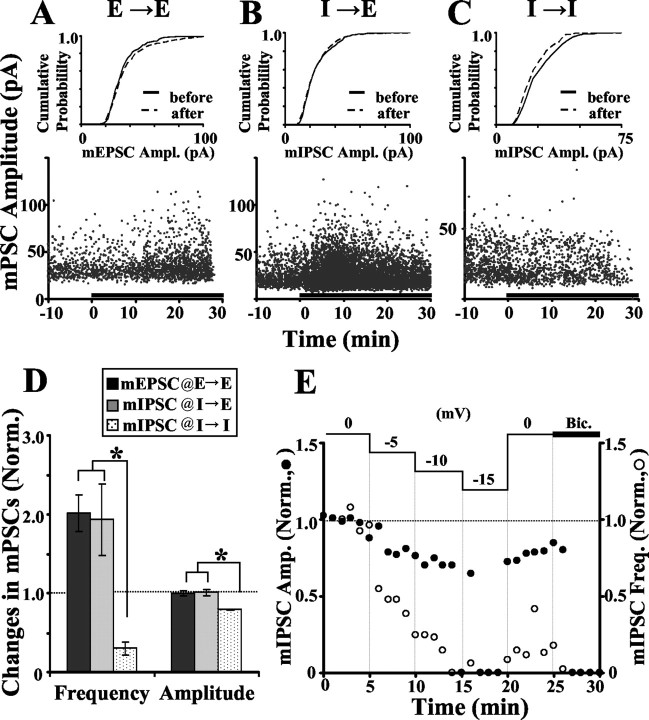
Figure 3.
BDNF effect on miniature postsynaptic currents. A, Example of mEPSCs at an E→E synapse. Bottom, Scatter plot of mEPSC amplitudes recorded before and after adding BDNF (black bar) in the presence of TTX and bicuculline. Top, Amplitude distribution for mEPSCs before (last 10 min of control; black line) and 15-25 min after (dashed line) BDNF treatment. No significant difference was found between distributions (p = 0.13; Kolmogorov-Smirnov test). Recording made with amphotericin B (Vh of -70 mV). B, Example of mIPSCs at an I→E synapse in the presence of TTX and CNQX, using breakthrough whole-cell recording at Vh of 0 mV (see Materials and Methods). Amplitude distribution shows no significant difference in mIPSC amplitudes at I→E before and after BDNF treatment (p = 0.40; Kolmogorov-Smirnov test). C, Example of mIPSC at I→I synapse, recorded similar to that described in B. Amplitude distributions show a significant difference before and after BDNF treatment (p = 0.008; Kolmogorov-Smirnov test). D, Summary of BDNF-induced changes in mPSC amplitude and frequency at E→E (n = 8), I→E (n = 7), and I→I (n = 4) synapses. Each bar represents the mean amplitude or frequency 15-30 min after the onset of BDNF treatment, normalized to the mean amplitude or frequency during the control period. Significant differences are indicated by asterisks (frequency, p < 0.01; amplitude, p < 0.001; ANOVA; Scheffe post hoc test). E, Recording of mIPSCs while changing Vh from 0 to -15 mV in 5 mV steps. Amplitude and frequency averaged over 1 min bins and normalized to the first 5 min of the recording (t = 0-5 min). At t = 25 min, bicuculline (Bic) was added to the recording solution.

