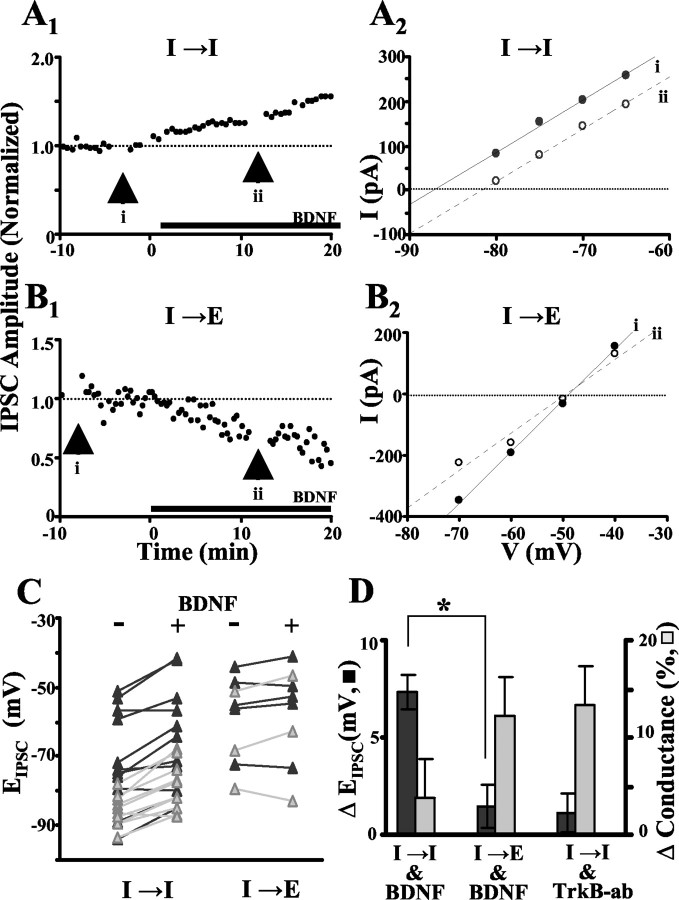
Figure 4.
Differential BDNF effects on IPSCs at I→I and I→E. A, B, Example of IPSCs at I→I(A1; gramicidin D) and I→E(B1; amphotericin B) before and after BDNF treatment (black bar). At the times indicated (i, ii; arrows), IPSC amplitudes were measured at different clamping voltages (in 5-10 mV steps) and plotted against the holding voltage in A2 and B2. The lines represent the best linear fit of data before (black line, black circles) and after (dashed line, white circles) BDNF treatment, its abscissa-intercept determines the EIPSC, and its slope is taken as the synaptic conductance. C, Summary plots showing EIPSC at I→I and I→E synapses before (-) and after (+) BDNF treatment for individual recordings performed with gramicidin D (gray triangles) or amphotericin B (black triangles). There was no significant difference between data obtained by the two methods at either I→I or I→E synapses (p = 0.27 and 0.42, respectively; unpaired t test). D, Summary plots of acute changes in EIPSC (in millivolts) and decrease in synaptic conductance (percentage) after adding BDNF (100 ng/ml), at I→I (n = 21) and I→E (n = 8) synapses, or removing endogenous BDNF activity by adding TrkB antibody (2 μg/ml; TrkB-ab) at I→I synapses (n = 4). At I→I versus I→E, significant difference was found between the BDNF effects on EIPSC (p < 0.0001; unpaired t test) but not between BDNF effects on conductance (p = 0.12; t test). TrkB antibody had no significant acute effect on EIPSC at I→I (p > 0.1; t test).

