
Figure 1.
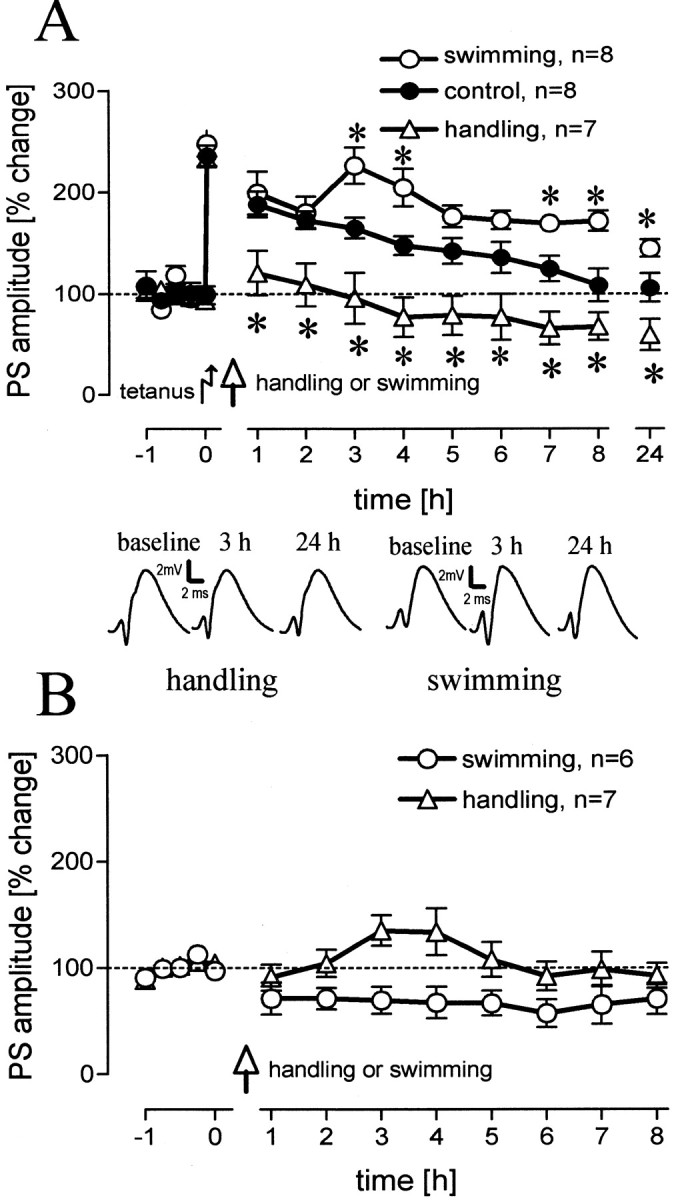
A, Population spike (PS) amplitudes (percentage change from baseline values) over 8 hr and a 24 hr value for rats that were handled 15 min after tetanization compared with unmanipulated animals (p = 0.024, 0.011, 0.016, 0.006, 0.007, 0.021, 0.003, 0.055, 0.021, levels for increasing time points) and for animals that experienced a 2 min swim compared with unmanipulated animals (p = 0.021, 0.012, 0.023, 0.005, 0.05, levels for increasing time points). Comparing the handled animals with the swimming animals reveals significant differences for all time points (p = 0.012, 0.007, 0.004, 0.0001, 0.0001, 0.0001, 0.0001, 0.0001, 0.0001). B, Baseline control groups were used for both behavioral manipulations. Means ± SEM are given. Asterisks indicate significant time point differences. The insets show representative analog traces for a handled and a swimming animal at the indicated time points. Horizontal dashed lines indicate the 100% level.